Case study — Startup Founder
Desaparecido
An open-source machine-learning platform for missing-person rescue, born from my Master's thesis and tested in the field with a fire brigade.
Key outcome
From Master's thesis to company: an ML tool used by real rescue teams
20k+
People reported missing every year in Spain (Ministry of the Interior, 2020)
3
Person startup; everyone wore several hats, and I owned product and design
- Role
- Cofounder, CEO and CPO at a 3-person startup
- Timeline
- 2020 to 2023 · Madrid, Spain
- Scale
- Open source · beta-deployed with the Girona fire brigade, then a Guardia Civil collaboration
- Stack
- Figma · Vue · Svelte · TypeScript · Tailwind CSS · FastAPI · Python · scikit-learn · GIS · Vercel · GitHub · Notion
- Figma
- Vue
- Svelte
- TypeScript
- Tailwind CSS
- Vercel
- GitHub
- Notion
When someone goes missing, the first hours decide the outcome. This began as my Master’s thesis and became an open-source company that put the research into the hands of real rescue teams.
The problem
Search and rescue coordination still ran on paper maps and radio. When someone disappears, coordinators must decide in minutes where to send their teams, while the models that could help them stay locked in academic papers instead of in any tool a field team could open.
The research: from thesis to fielded tool
My Master’s thesis (UPM, 2021, advised by Dr. Alfonso Mateos Caballero) asked two questions of real operational data: predict the medical outcome of a missing person, and prioritize where to search first.
First I had to build the data. Most of it didn’t exist in machine-readable form, so I created two datasets: 183 searches hand-collected from paper SAR reports in Catalan fire-station archives (only 49 clean enough to learn from), and Dr. Robert Koester’s ISRID, with 6,764 international cases.
The domain knowledge wasn’t in any archive either. So Girona’s SAR experts and an emergency psychologist co-defined the ten profiles of how lost people actually behave, and stayed on as the reality check for every design that followed.
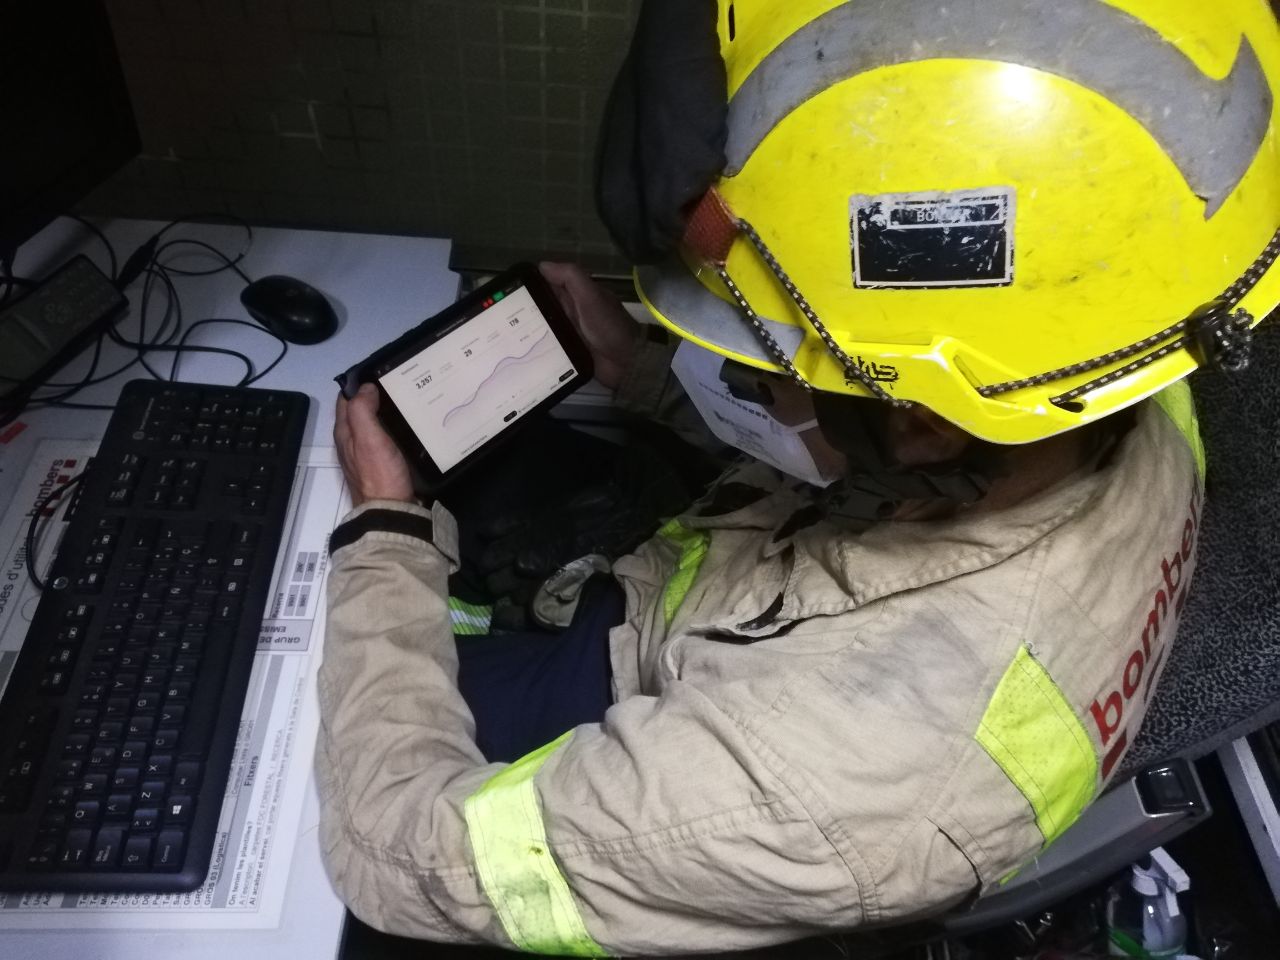
Design for a stressed coordinator, at night, on a low-bandwidth tablet, who has never seen the software before. Every screen had to survive that.
Why the first hours decide
Lost people don’t behave randomly. They behave by profile, and every profile is racing a clock. The interaction below is the finding that justified the whole company.
Search outcomes over time — dementia cases
For missing dementia patients, the odds of a happy ending fall away hour by hour: no deaths when found within 24 hours, but mortality climbs steeply past it. Real data from the thesis. Hover a bar for the breakdown.
The thesis reports no fatalities when a dementia patient was located within 24 hours, rising to roughly 46% mortality beyond it — and the effective search area grows about 3 km every hour. Speed is the whole game.
Predicting the outcome
An interpretable decision tree takes a case (age, activity, terrain, group, scenario) and predicts medical status. I chose a single readable tree over a black box on purpose, because a coordinator has to trust why a prediction was made and not only the number it lands on.
How well the model predicted outcomes
A decision tree classifying each missing person's medical outcome. Precision, recall and F1 per outcome class. Switch datasets to see how much data changes the story.
Overall accuracy
64%
Dr. Robert Koester's international database — enough data to reach 77% on the most common 'Well' outcome.
The geographic-prediction goal proved out of reach. Neither dataset carried the spatial attributes it needed, so I scoped it as future work rather than fake it. That boundary is what the company was founded to cross.
The Vulnerability Model
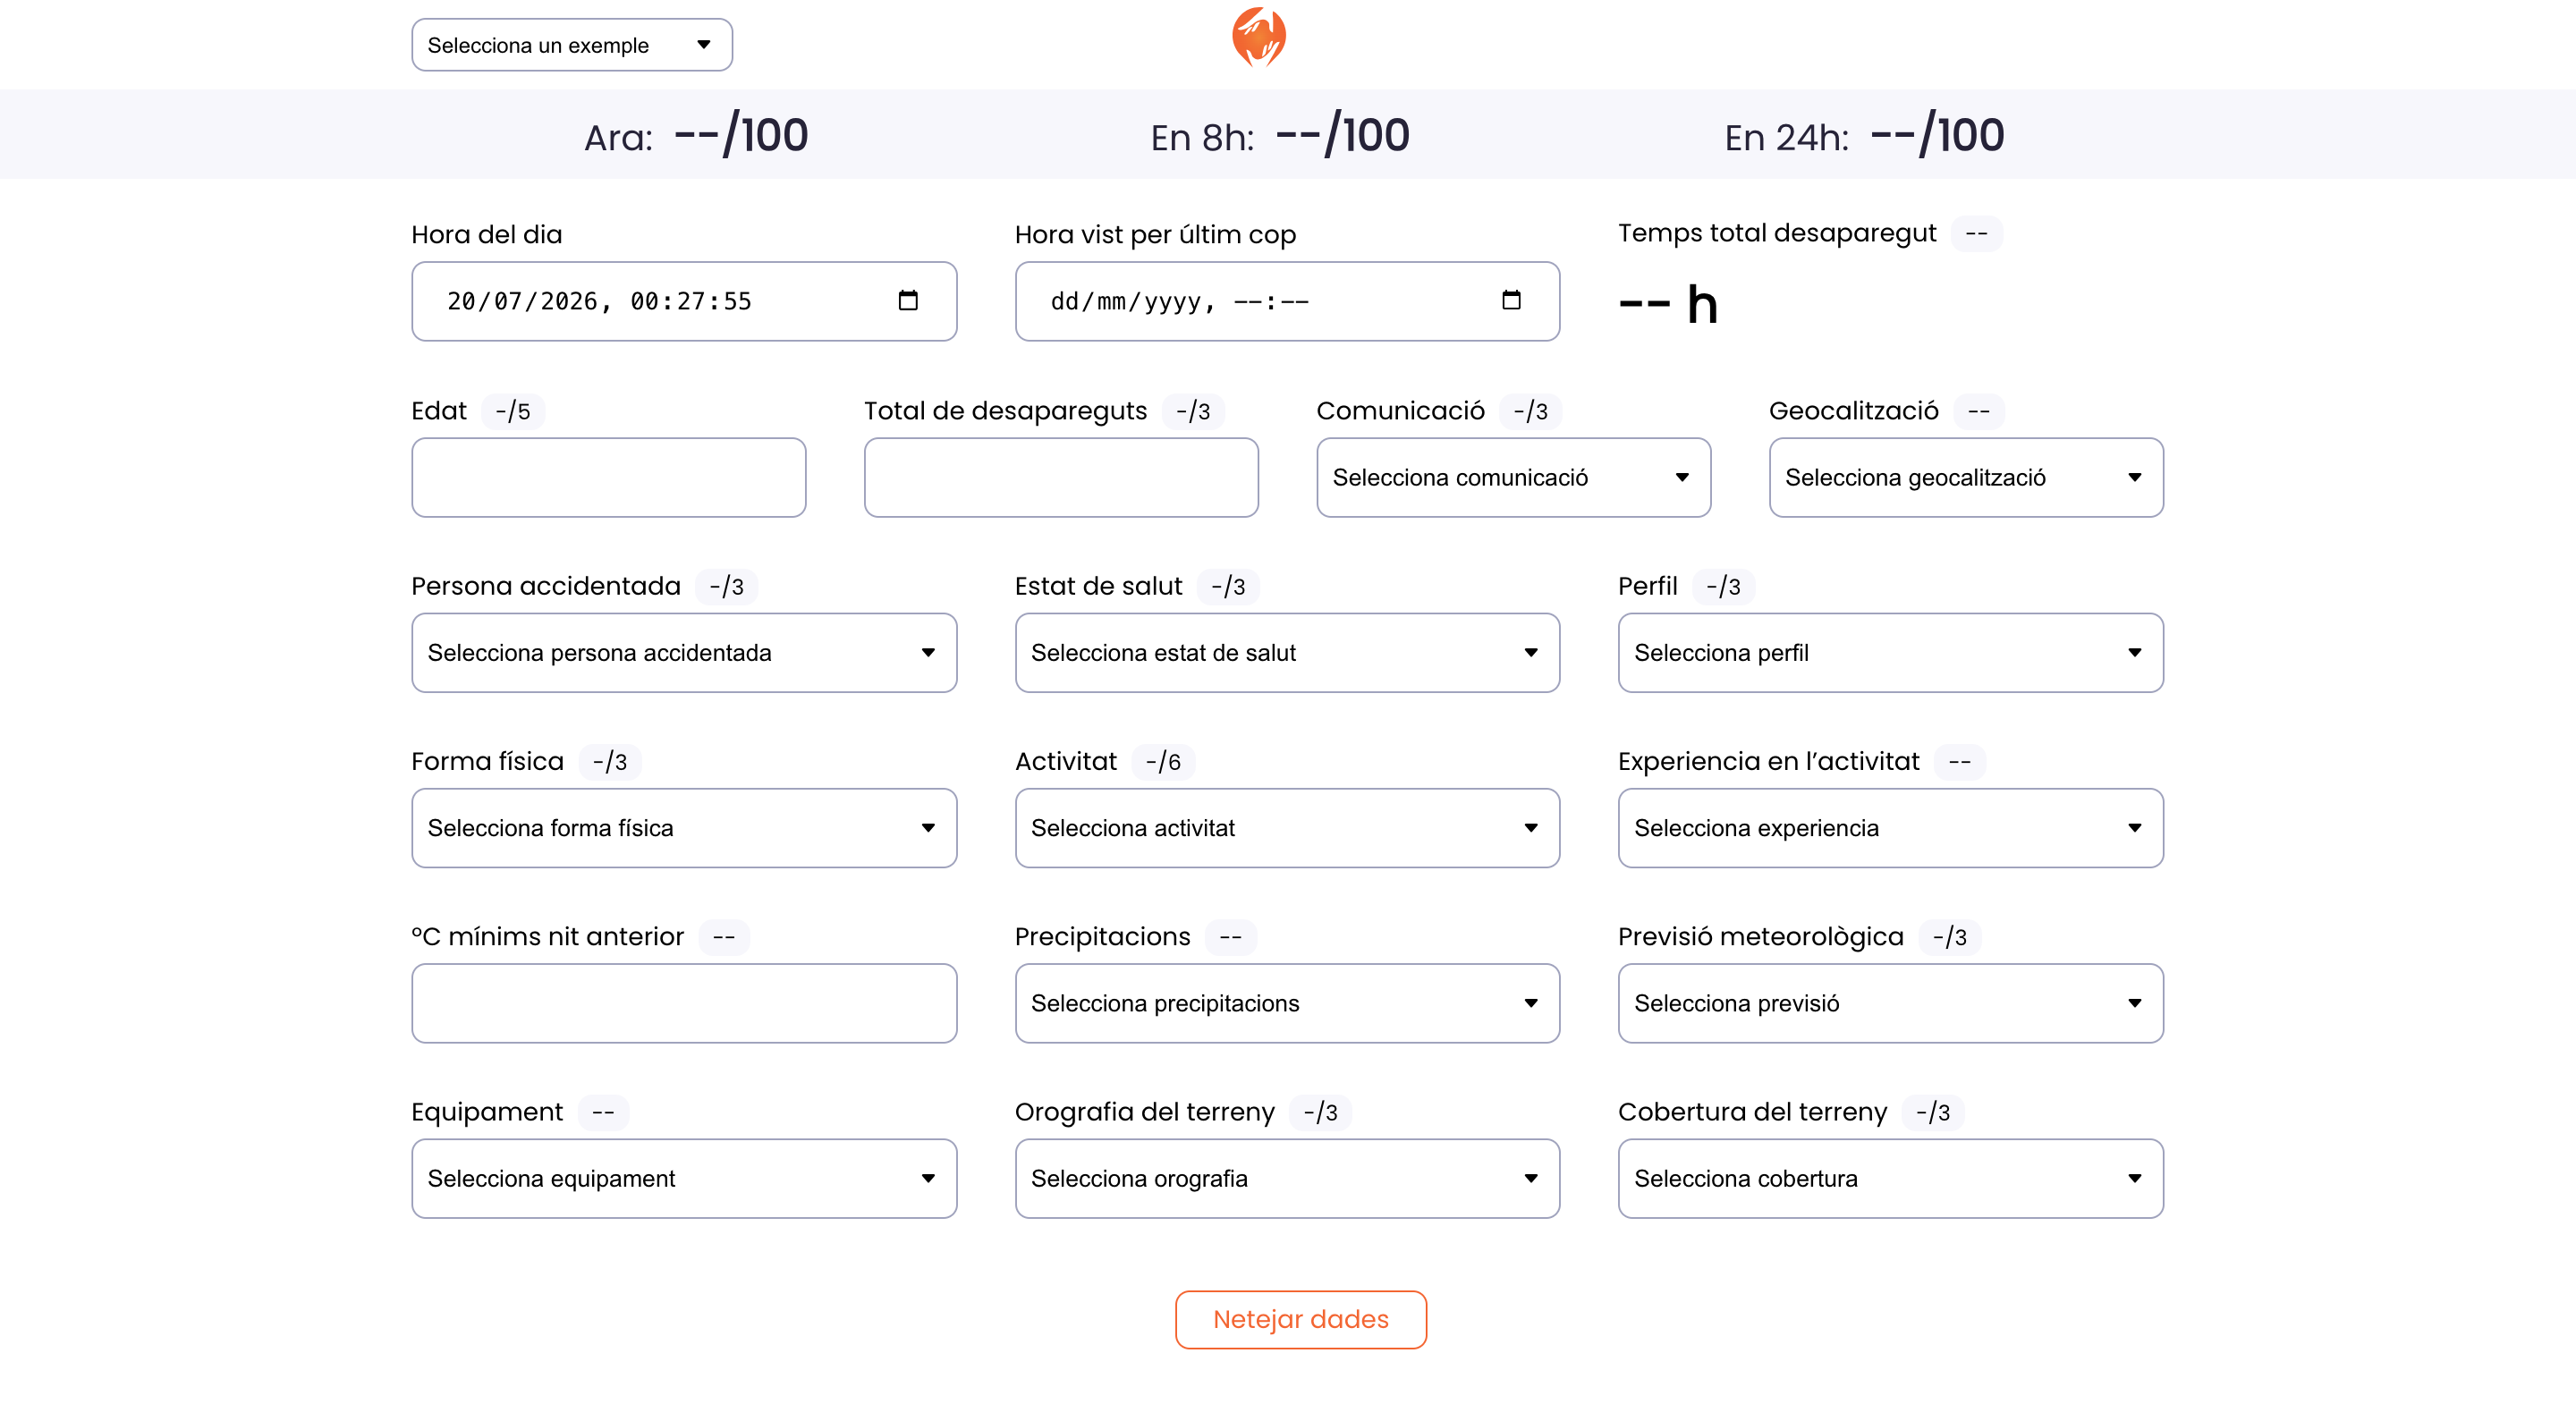
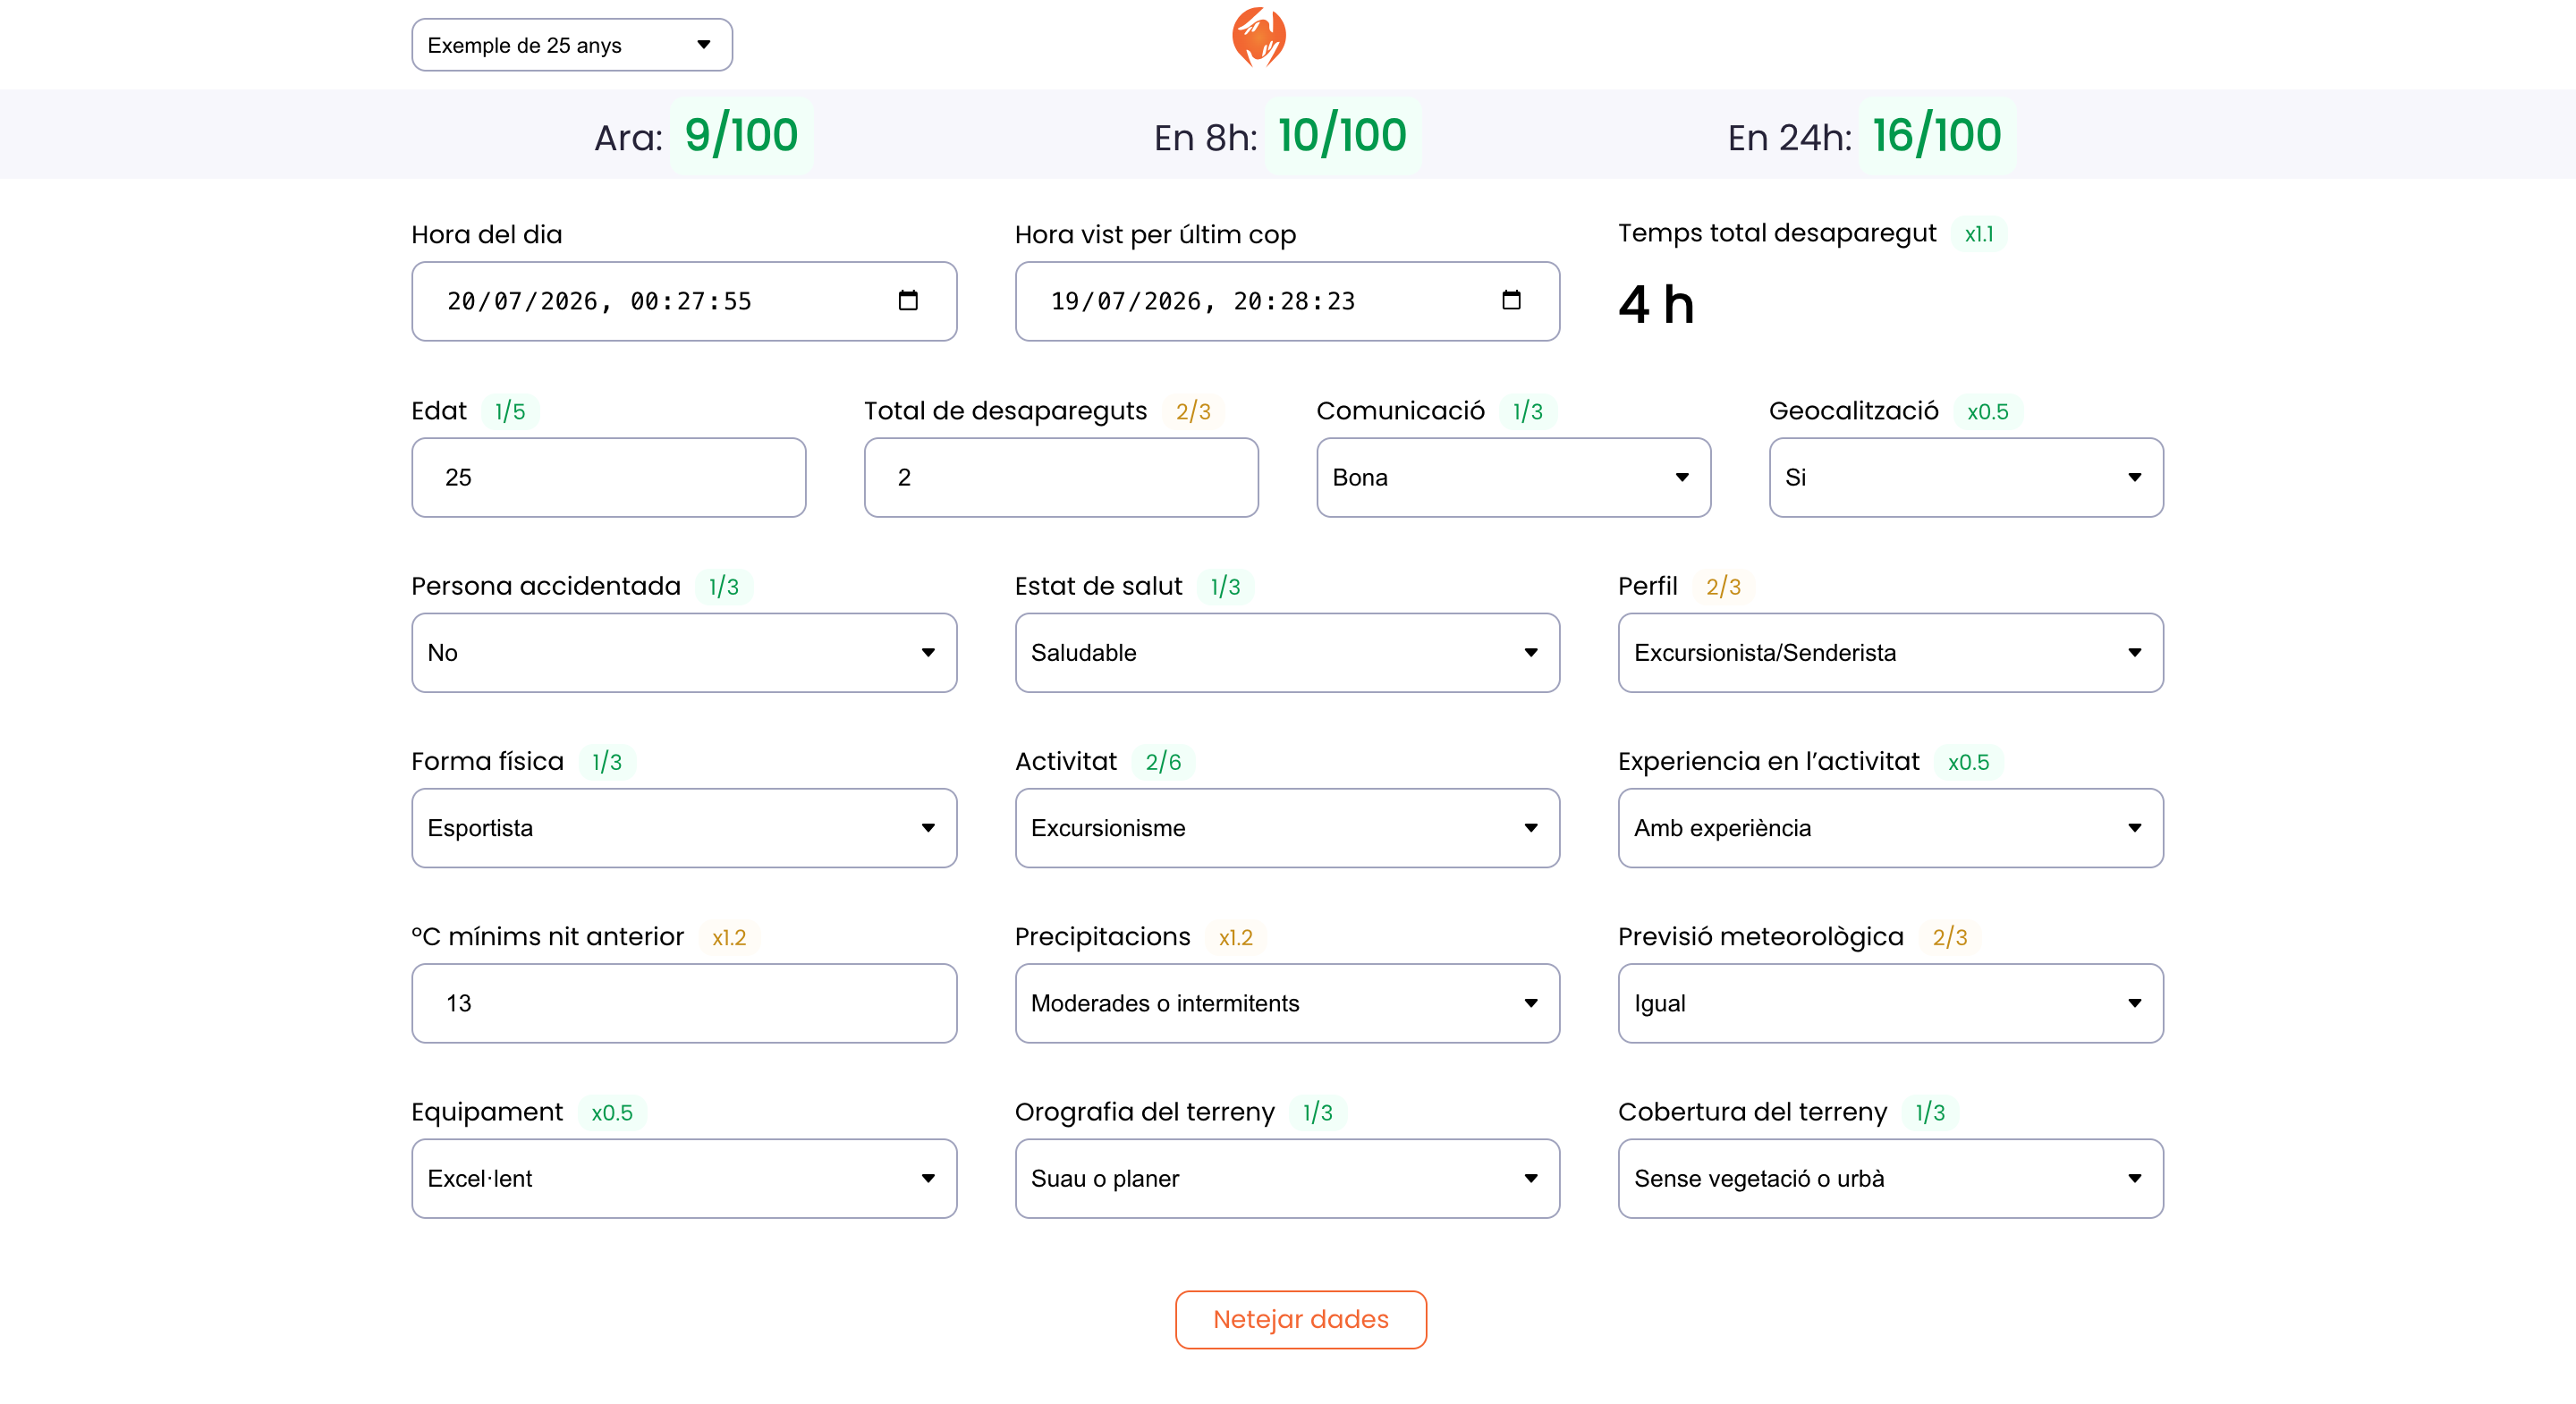
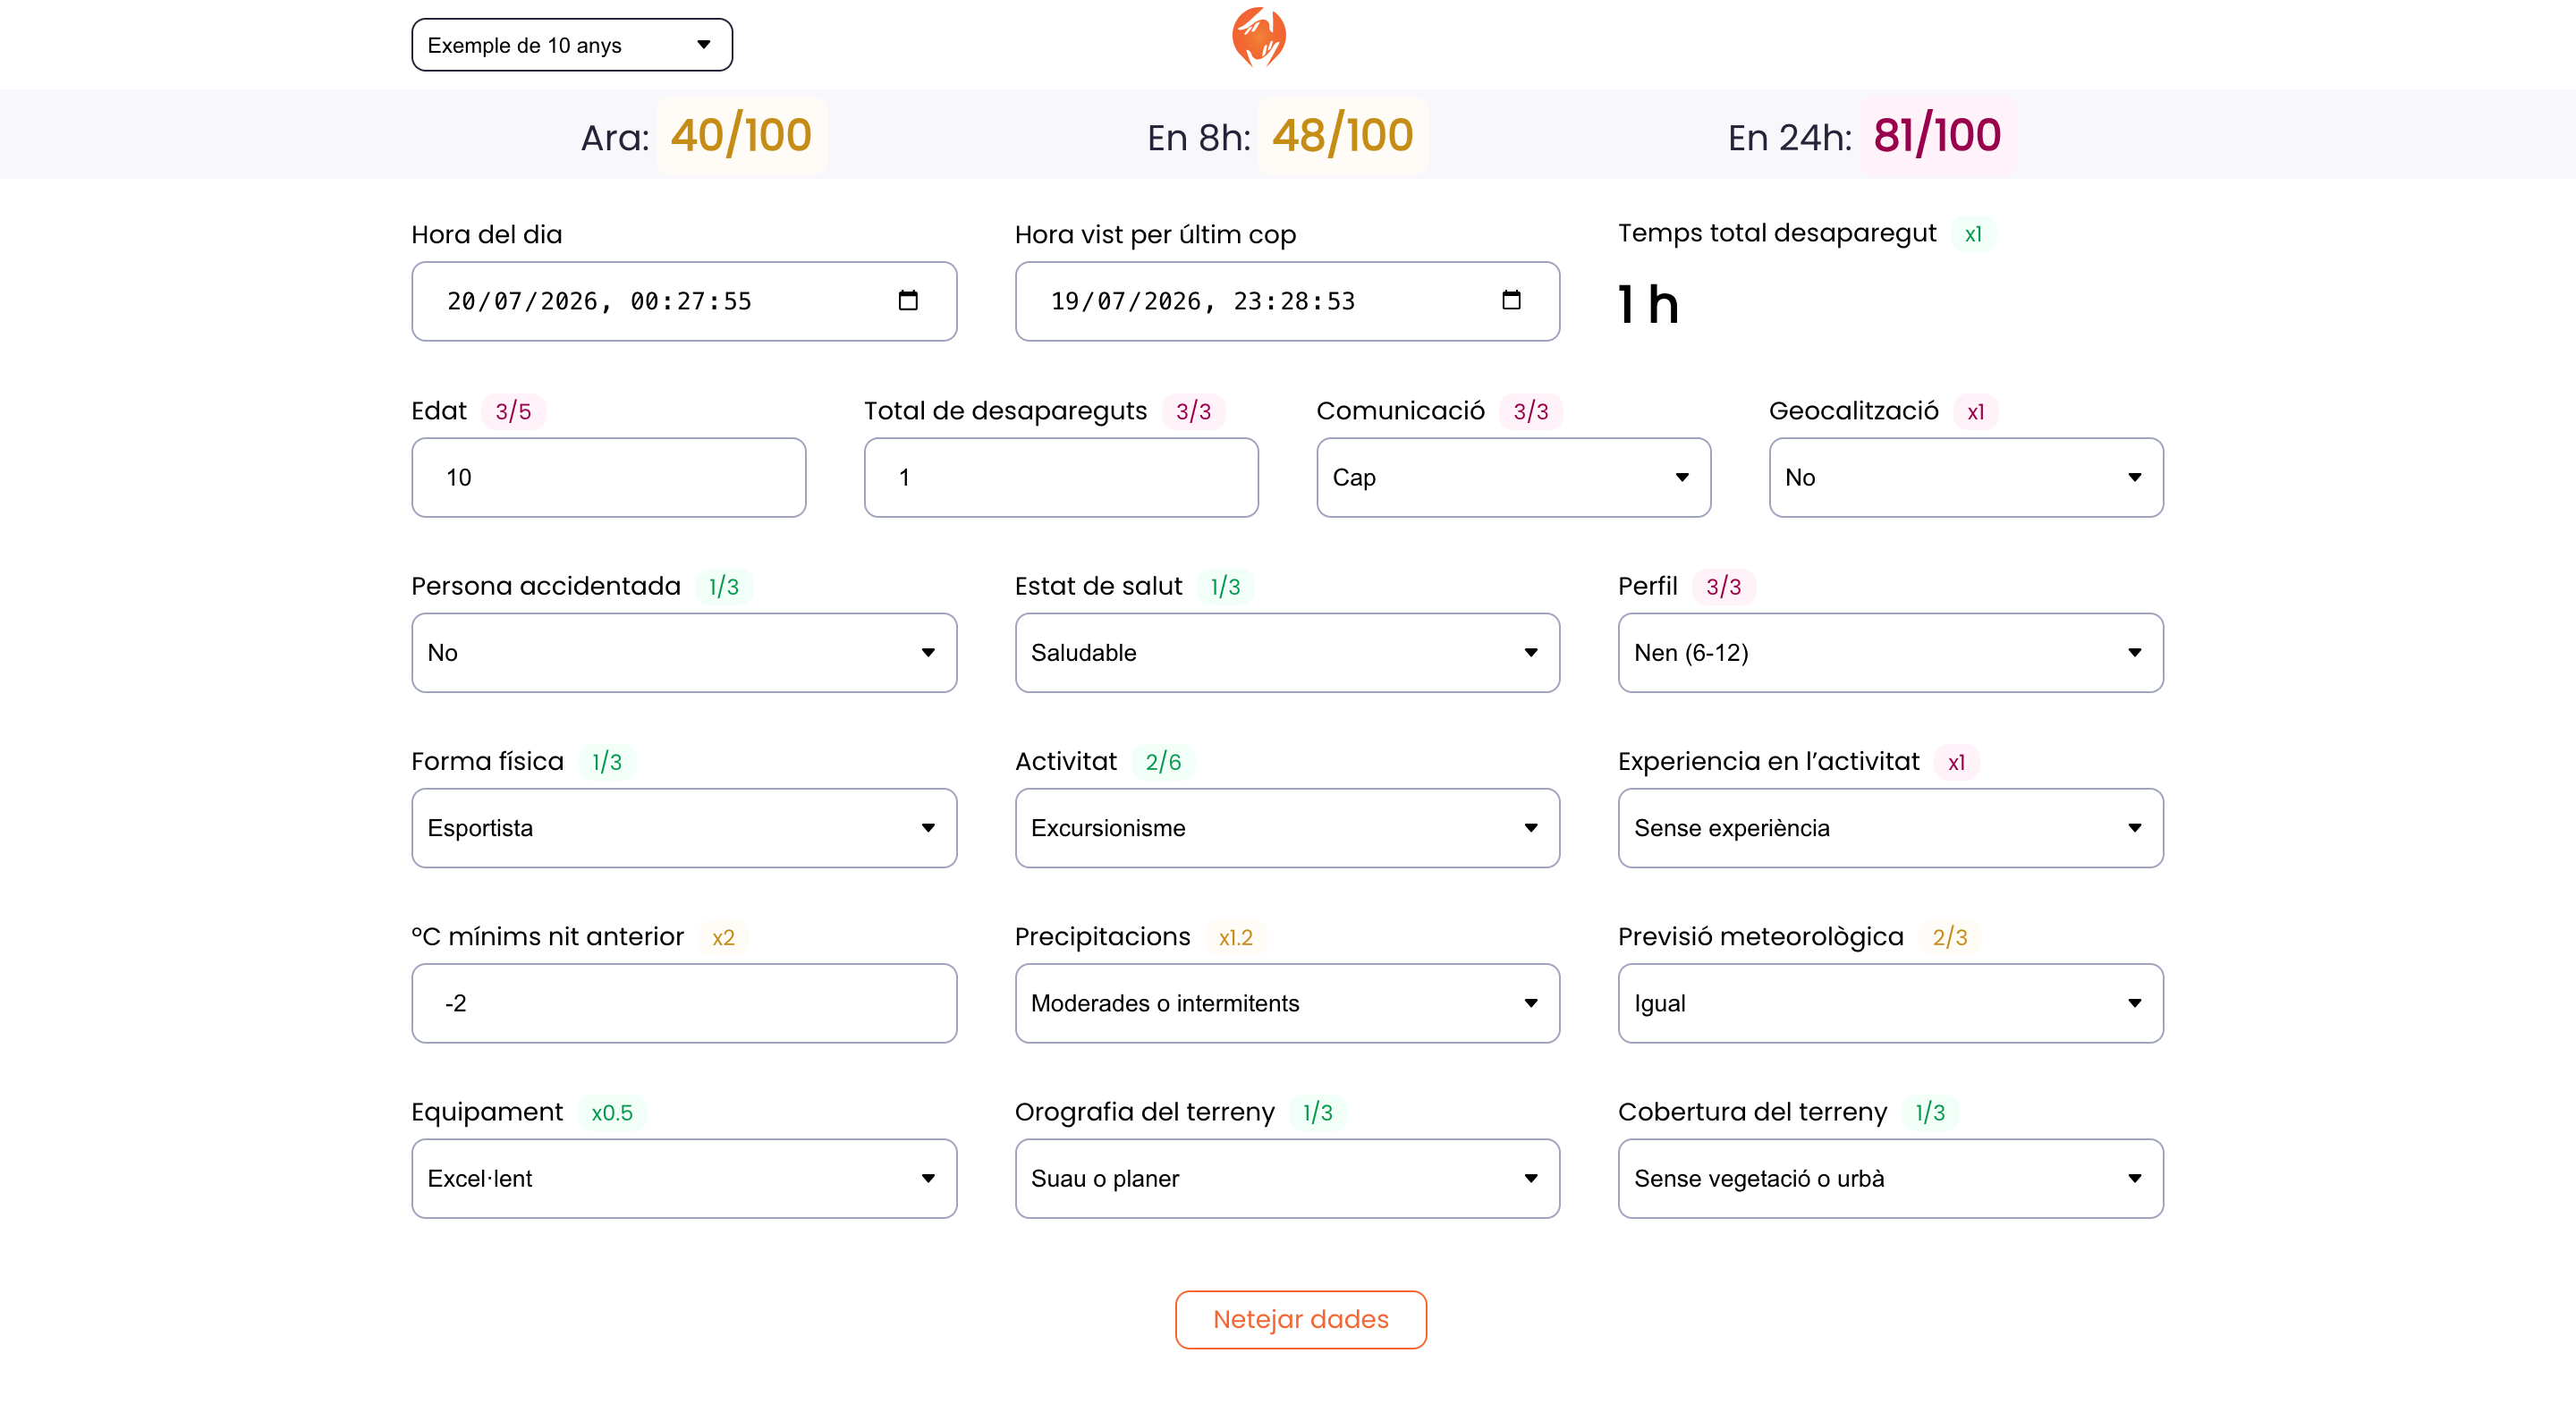
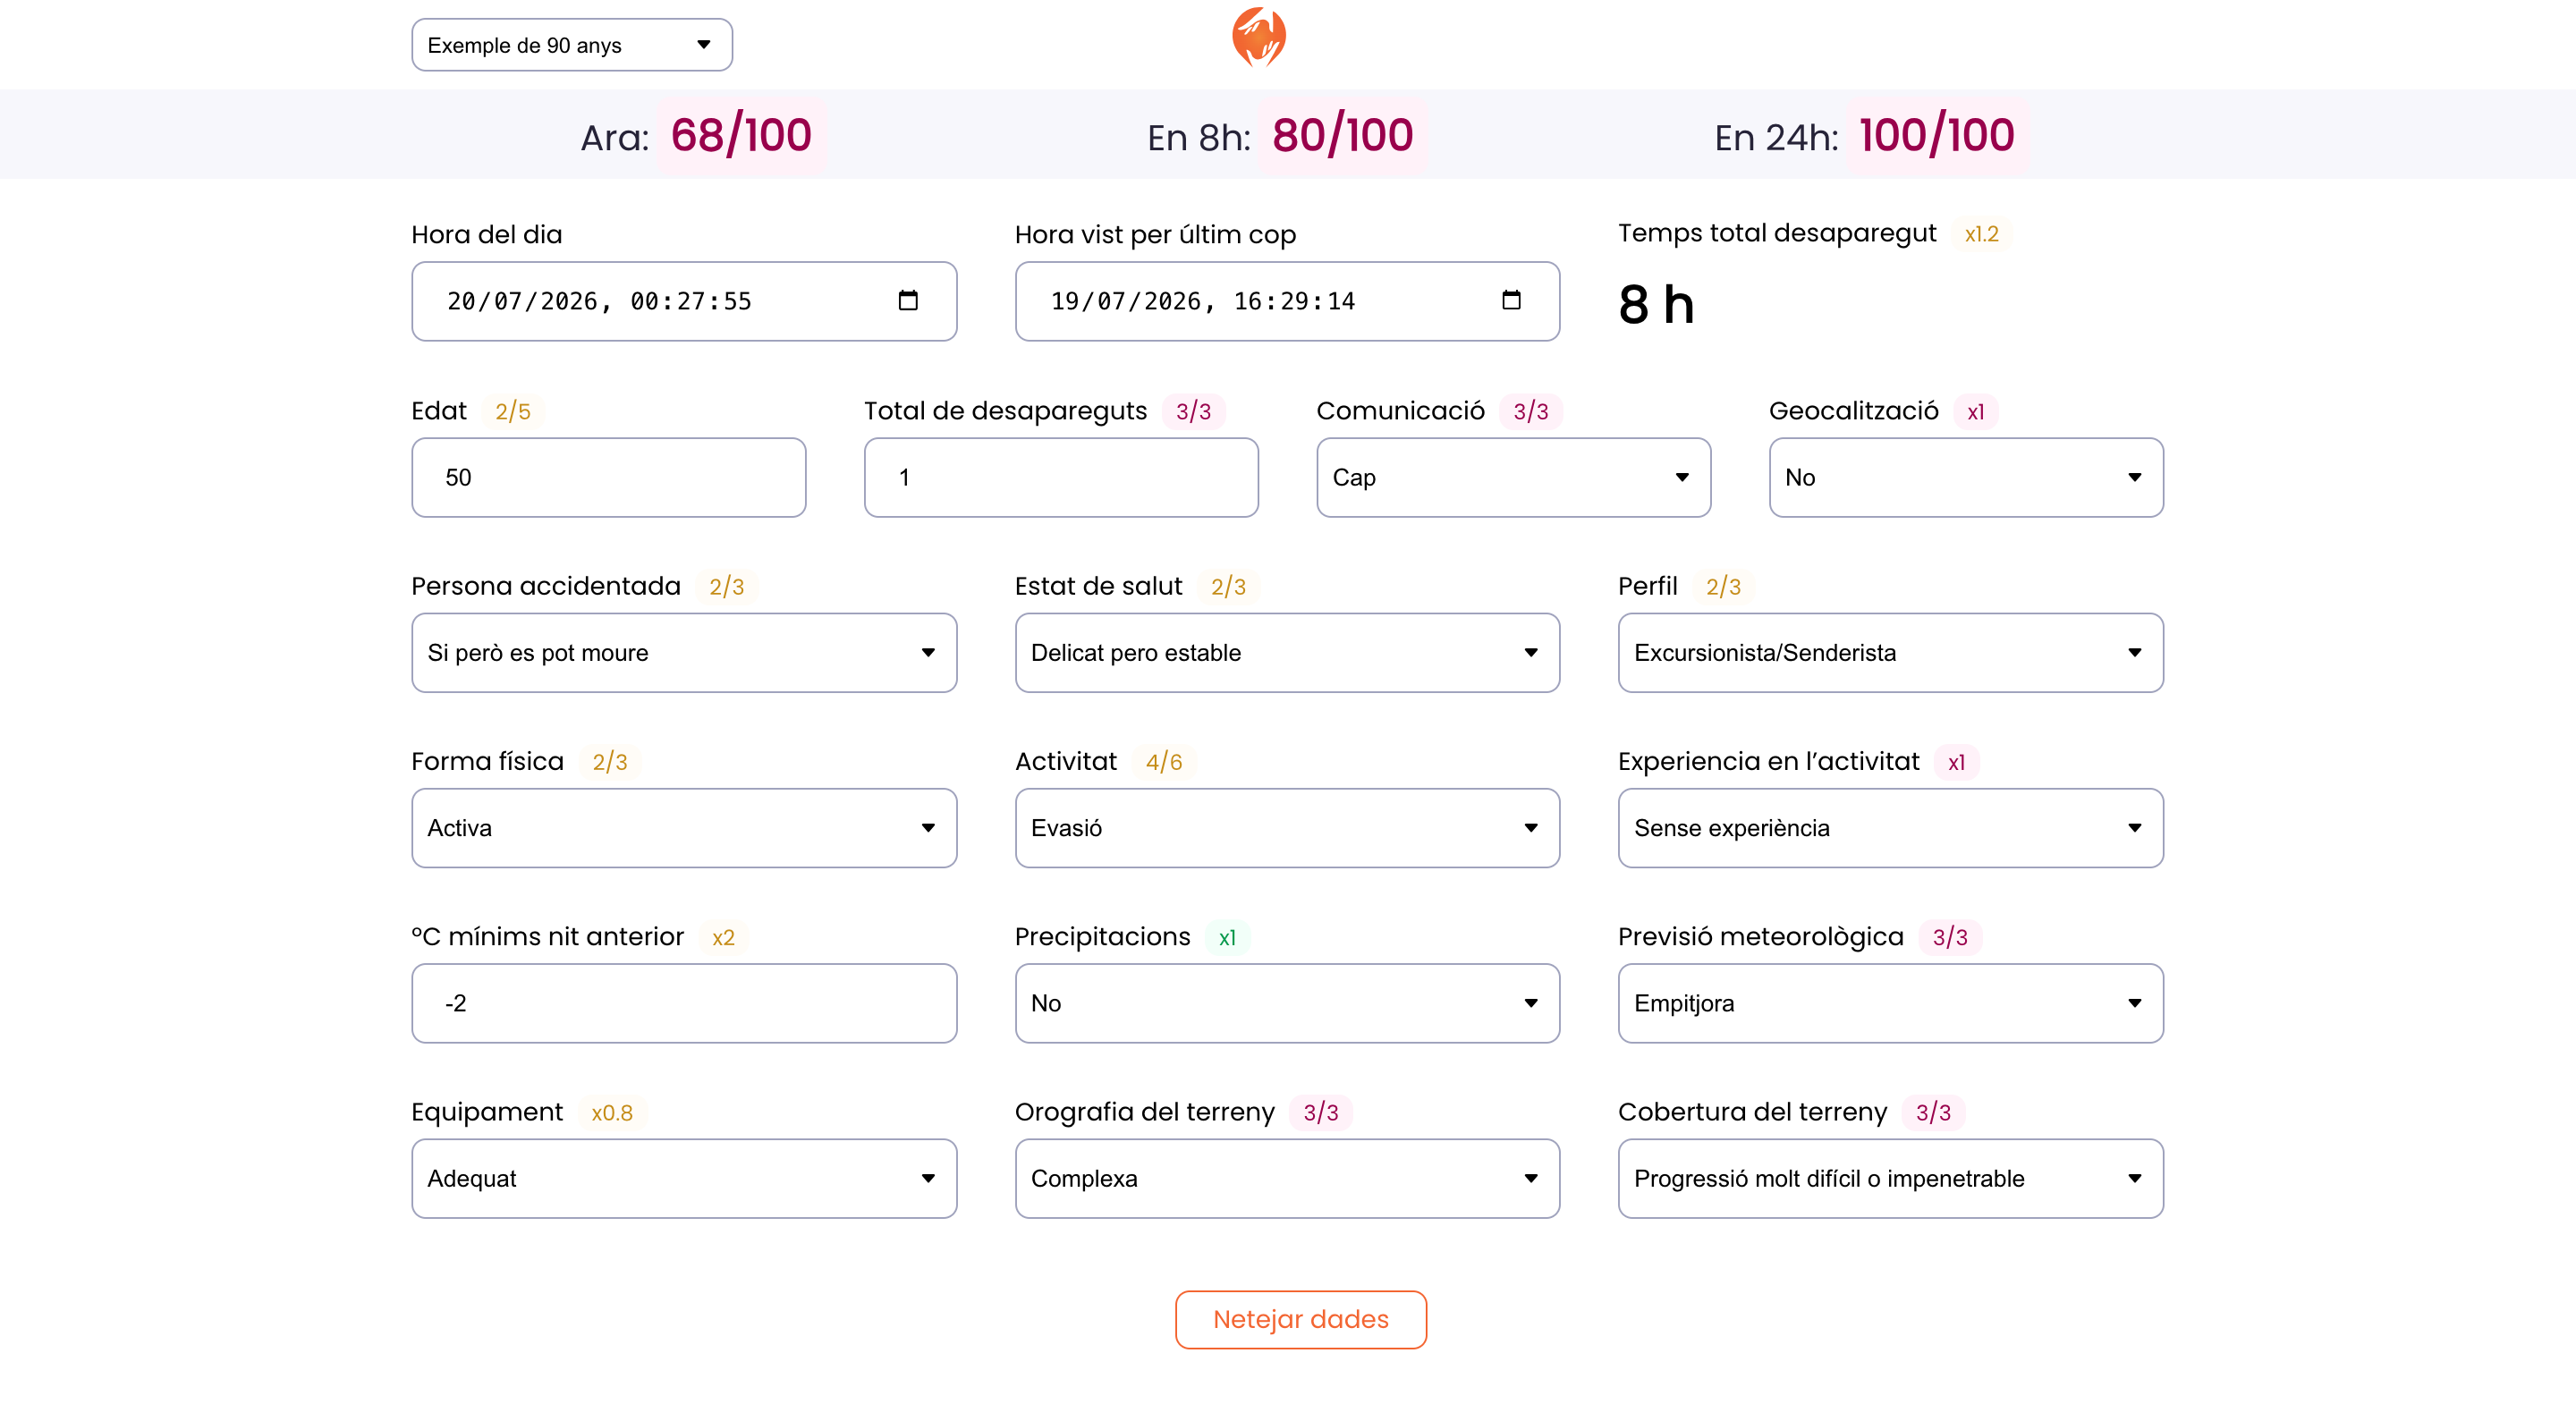
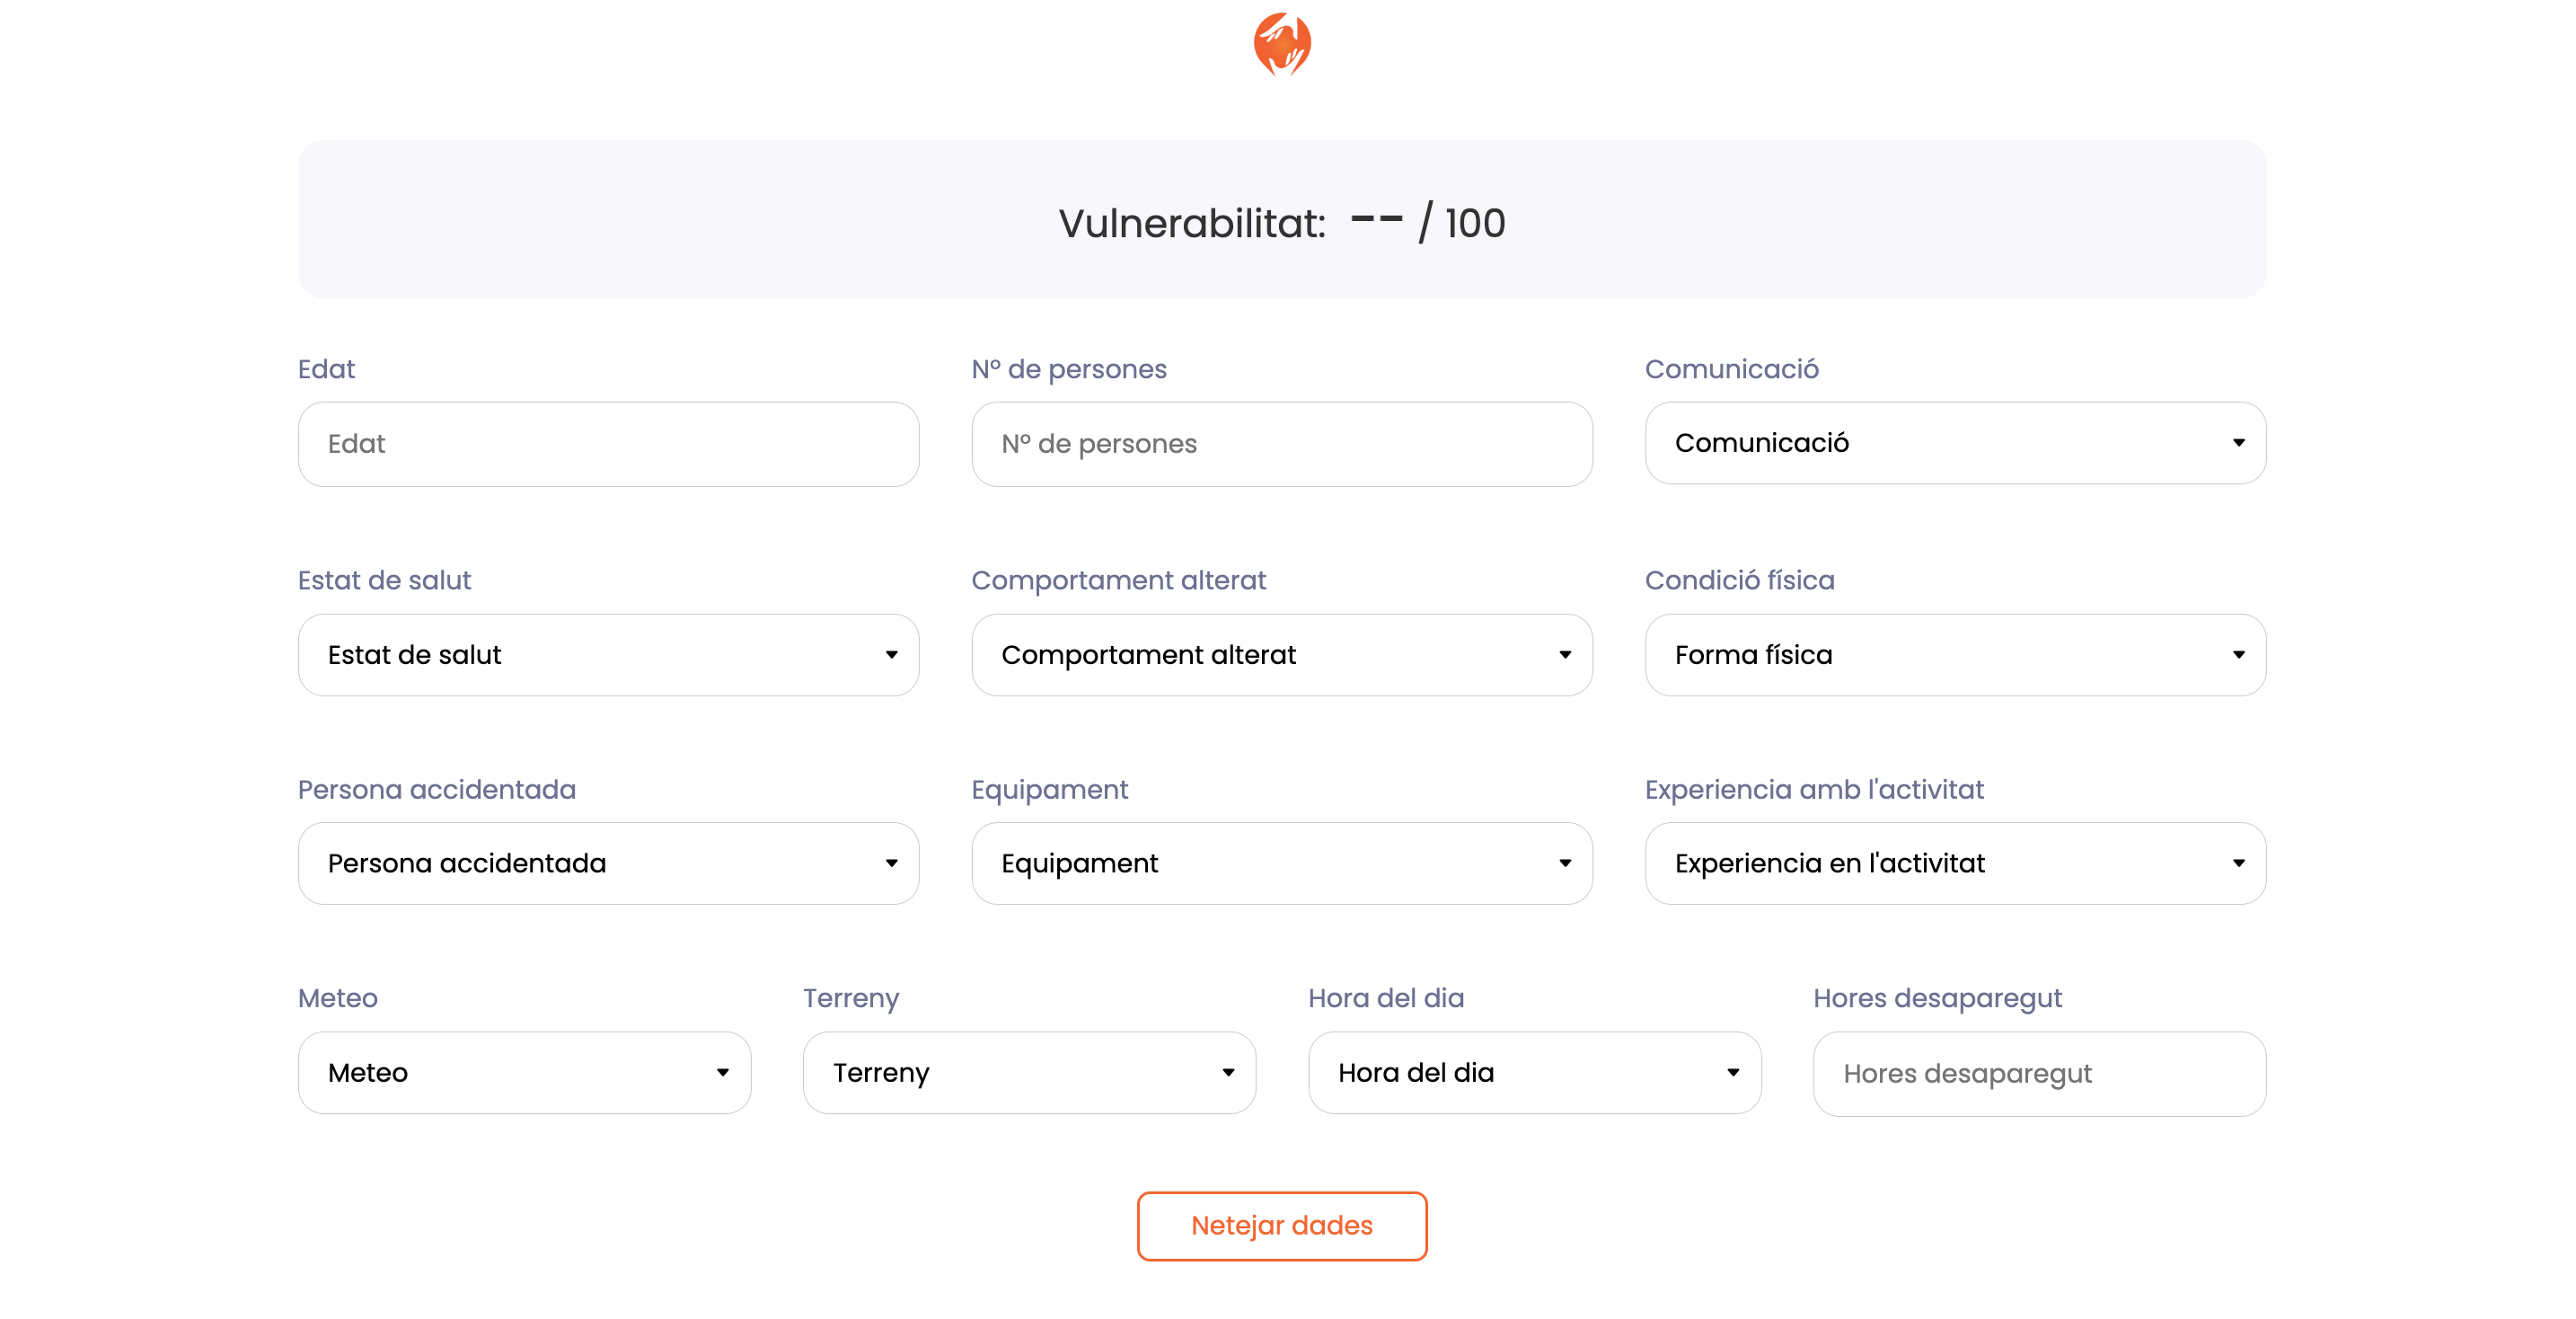
The company’s flagship tool. A coordinator describes the person and conditions, and it returns how vulnerable they are now, and how that climbs 8 and 24 hours out if the search stalls, with every field showing its own live contribution so the score is never a black box.
Vulnerability Model
Describe the missing person and the conditions; the model scores how vulnerable they are now and how that rises over time. Simplified to 9 of the 16 real factors — each badge shows its live contribution.
Now
11
Low
In 8h
12
Low
In 24h
19
Low
Additive factors sum, then scale by the time-missing, geoposition and temperature multipliers — the exact structure of the open-source v3 model. Sample weights.
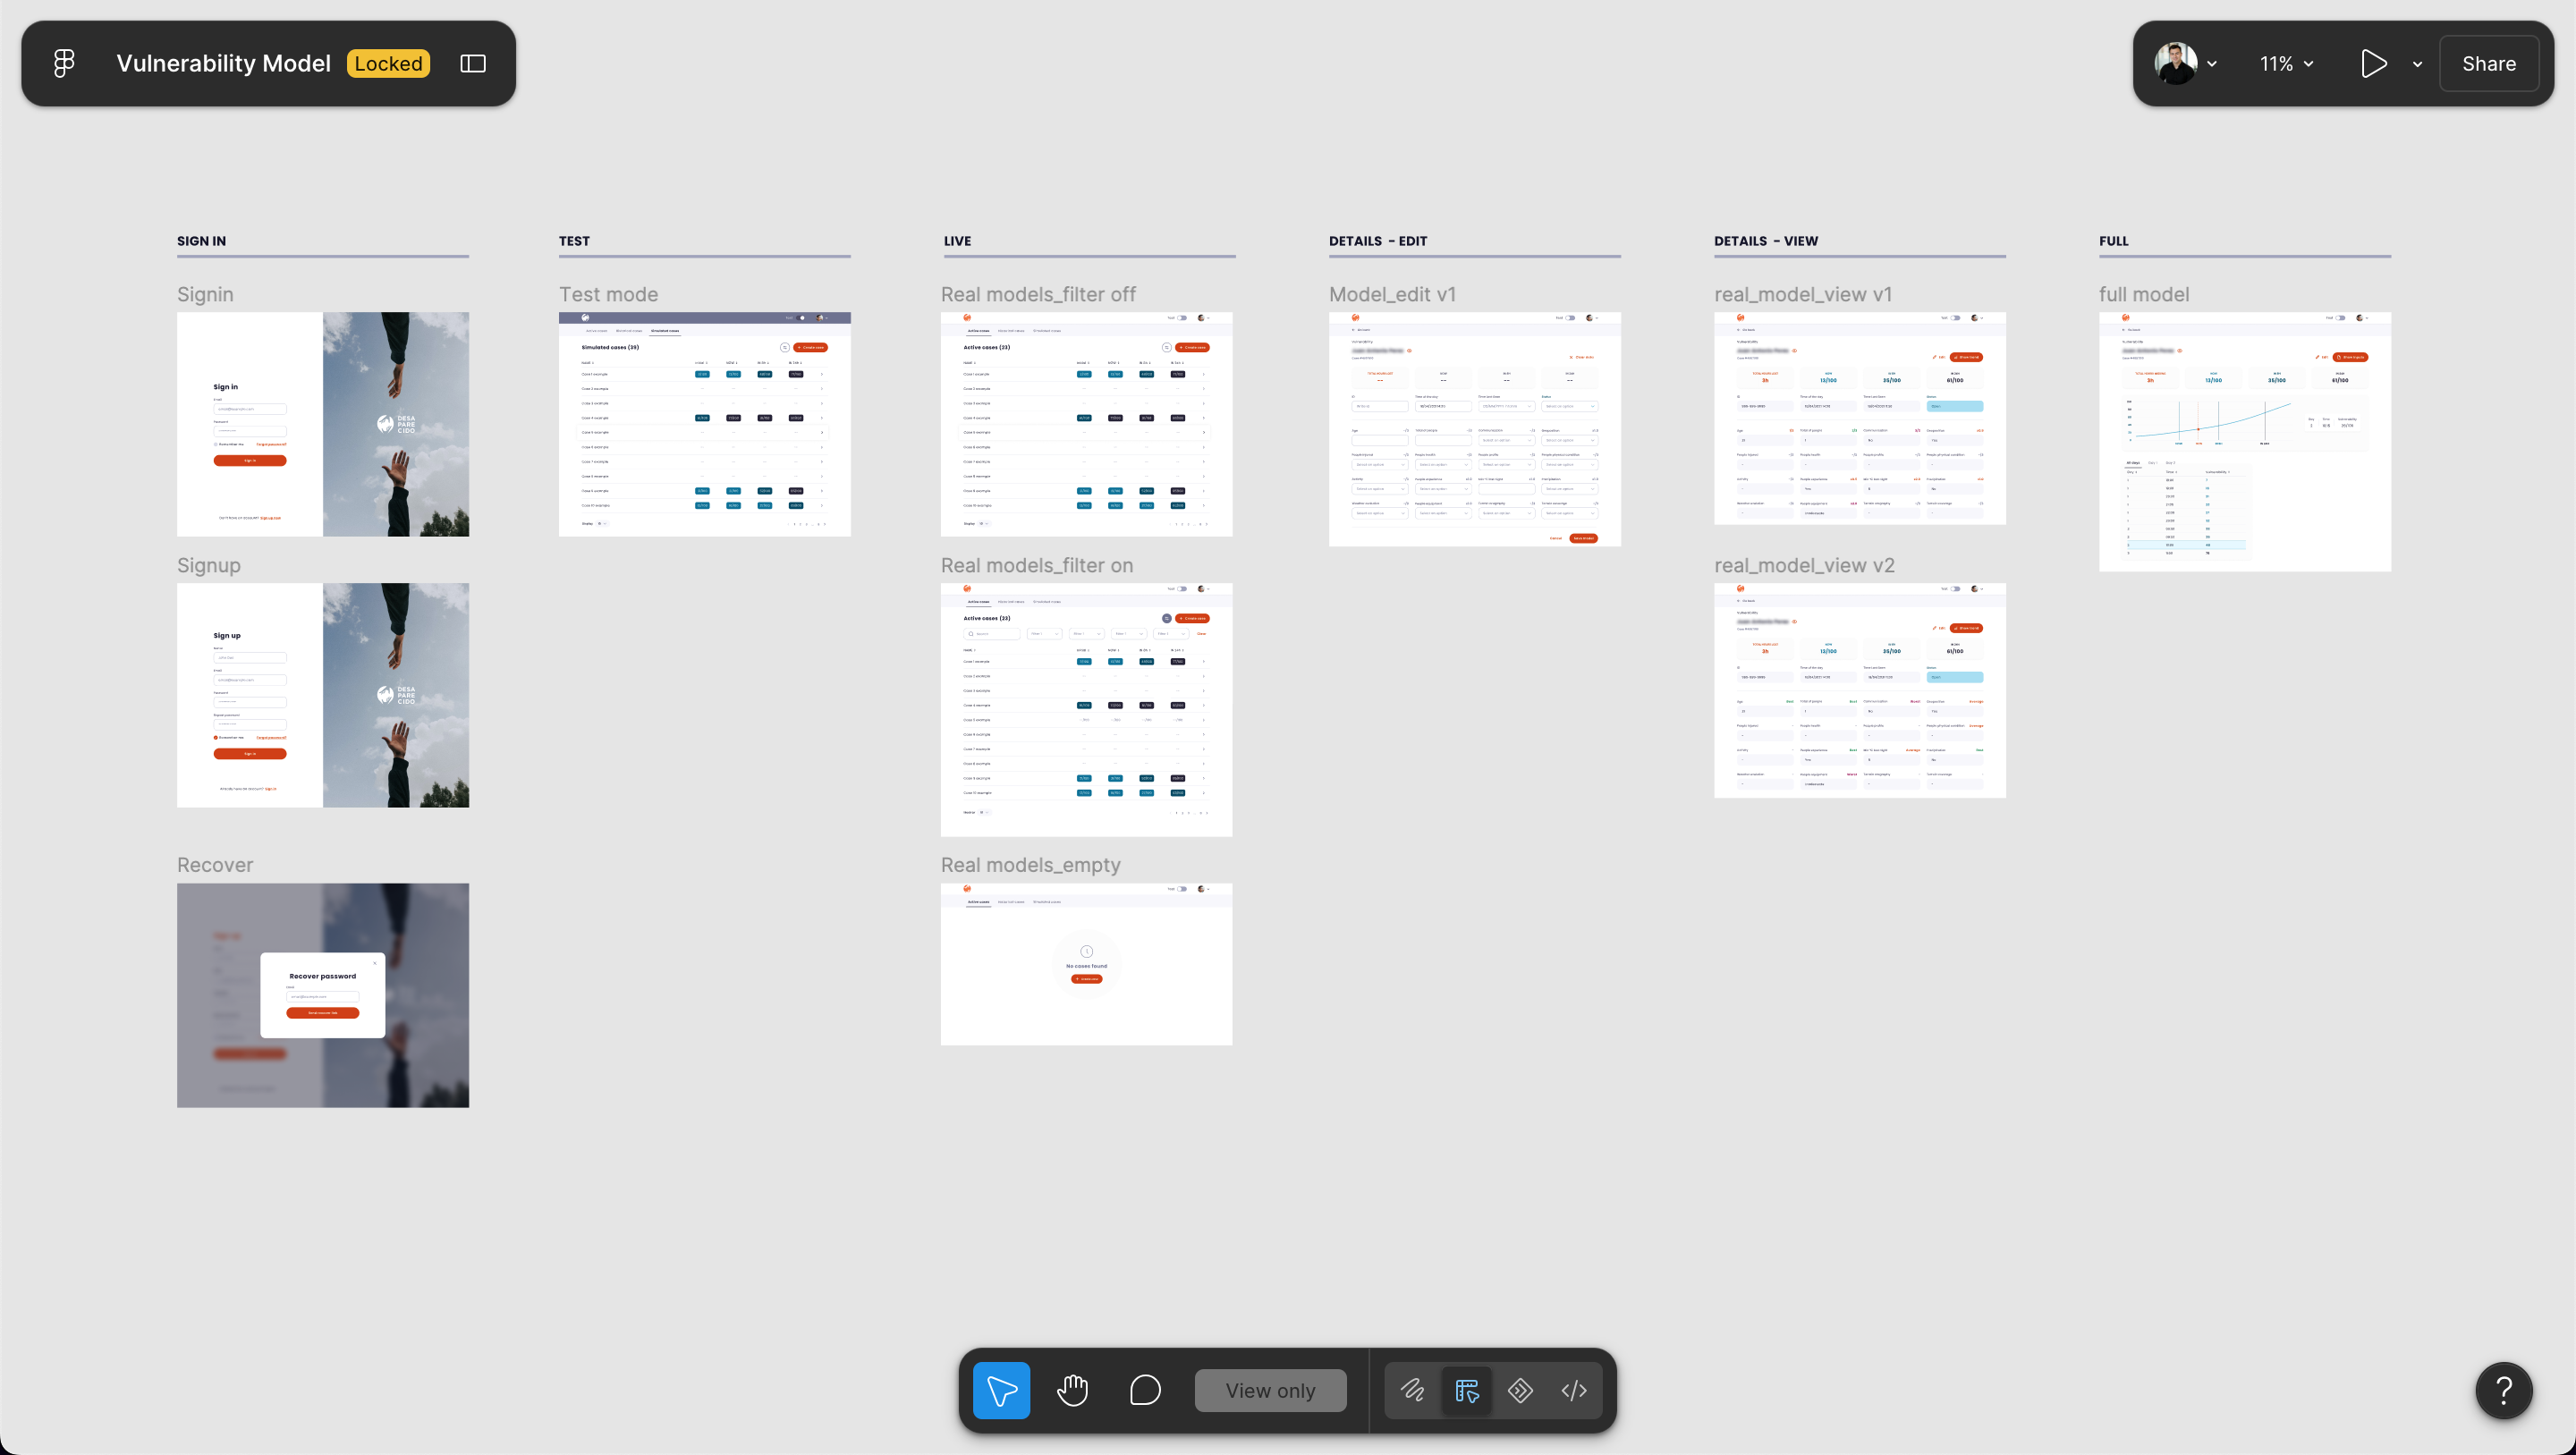
The screen was designed for every situation a coordinator meets, not just the demo case. Empty, low-risk, escalating and critical are four deliberately different reads of the same layout, on the green/amber/red triage scale used everywhere in the product.
Under the hood: Vue and Svelte clients on dynamic GIS tile servers (smooth on low-bandwidth emergency tablets), FastAPI routes to the Python prediction engines, and the model shipped as three public open-source iterations.
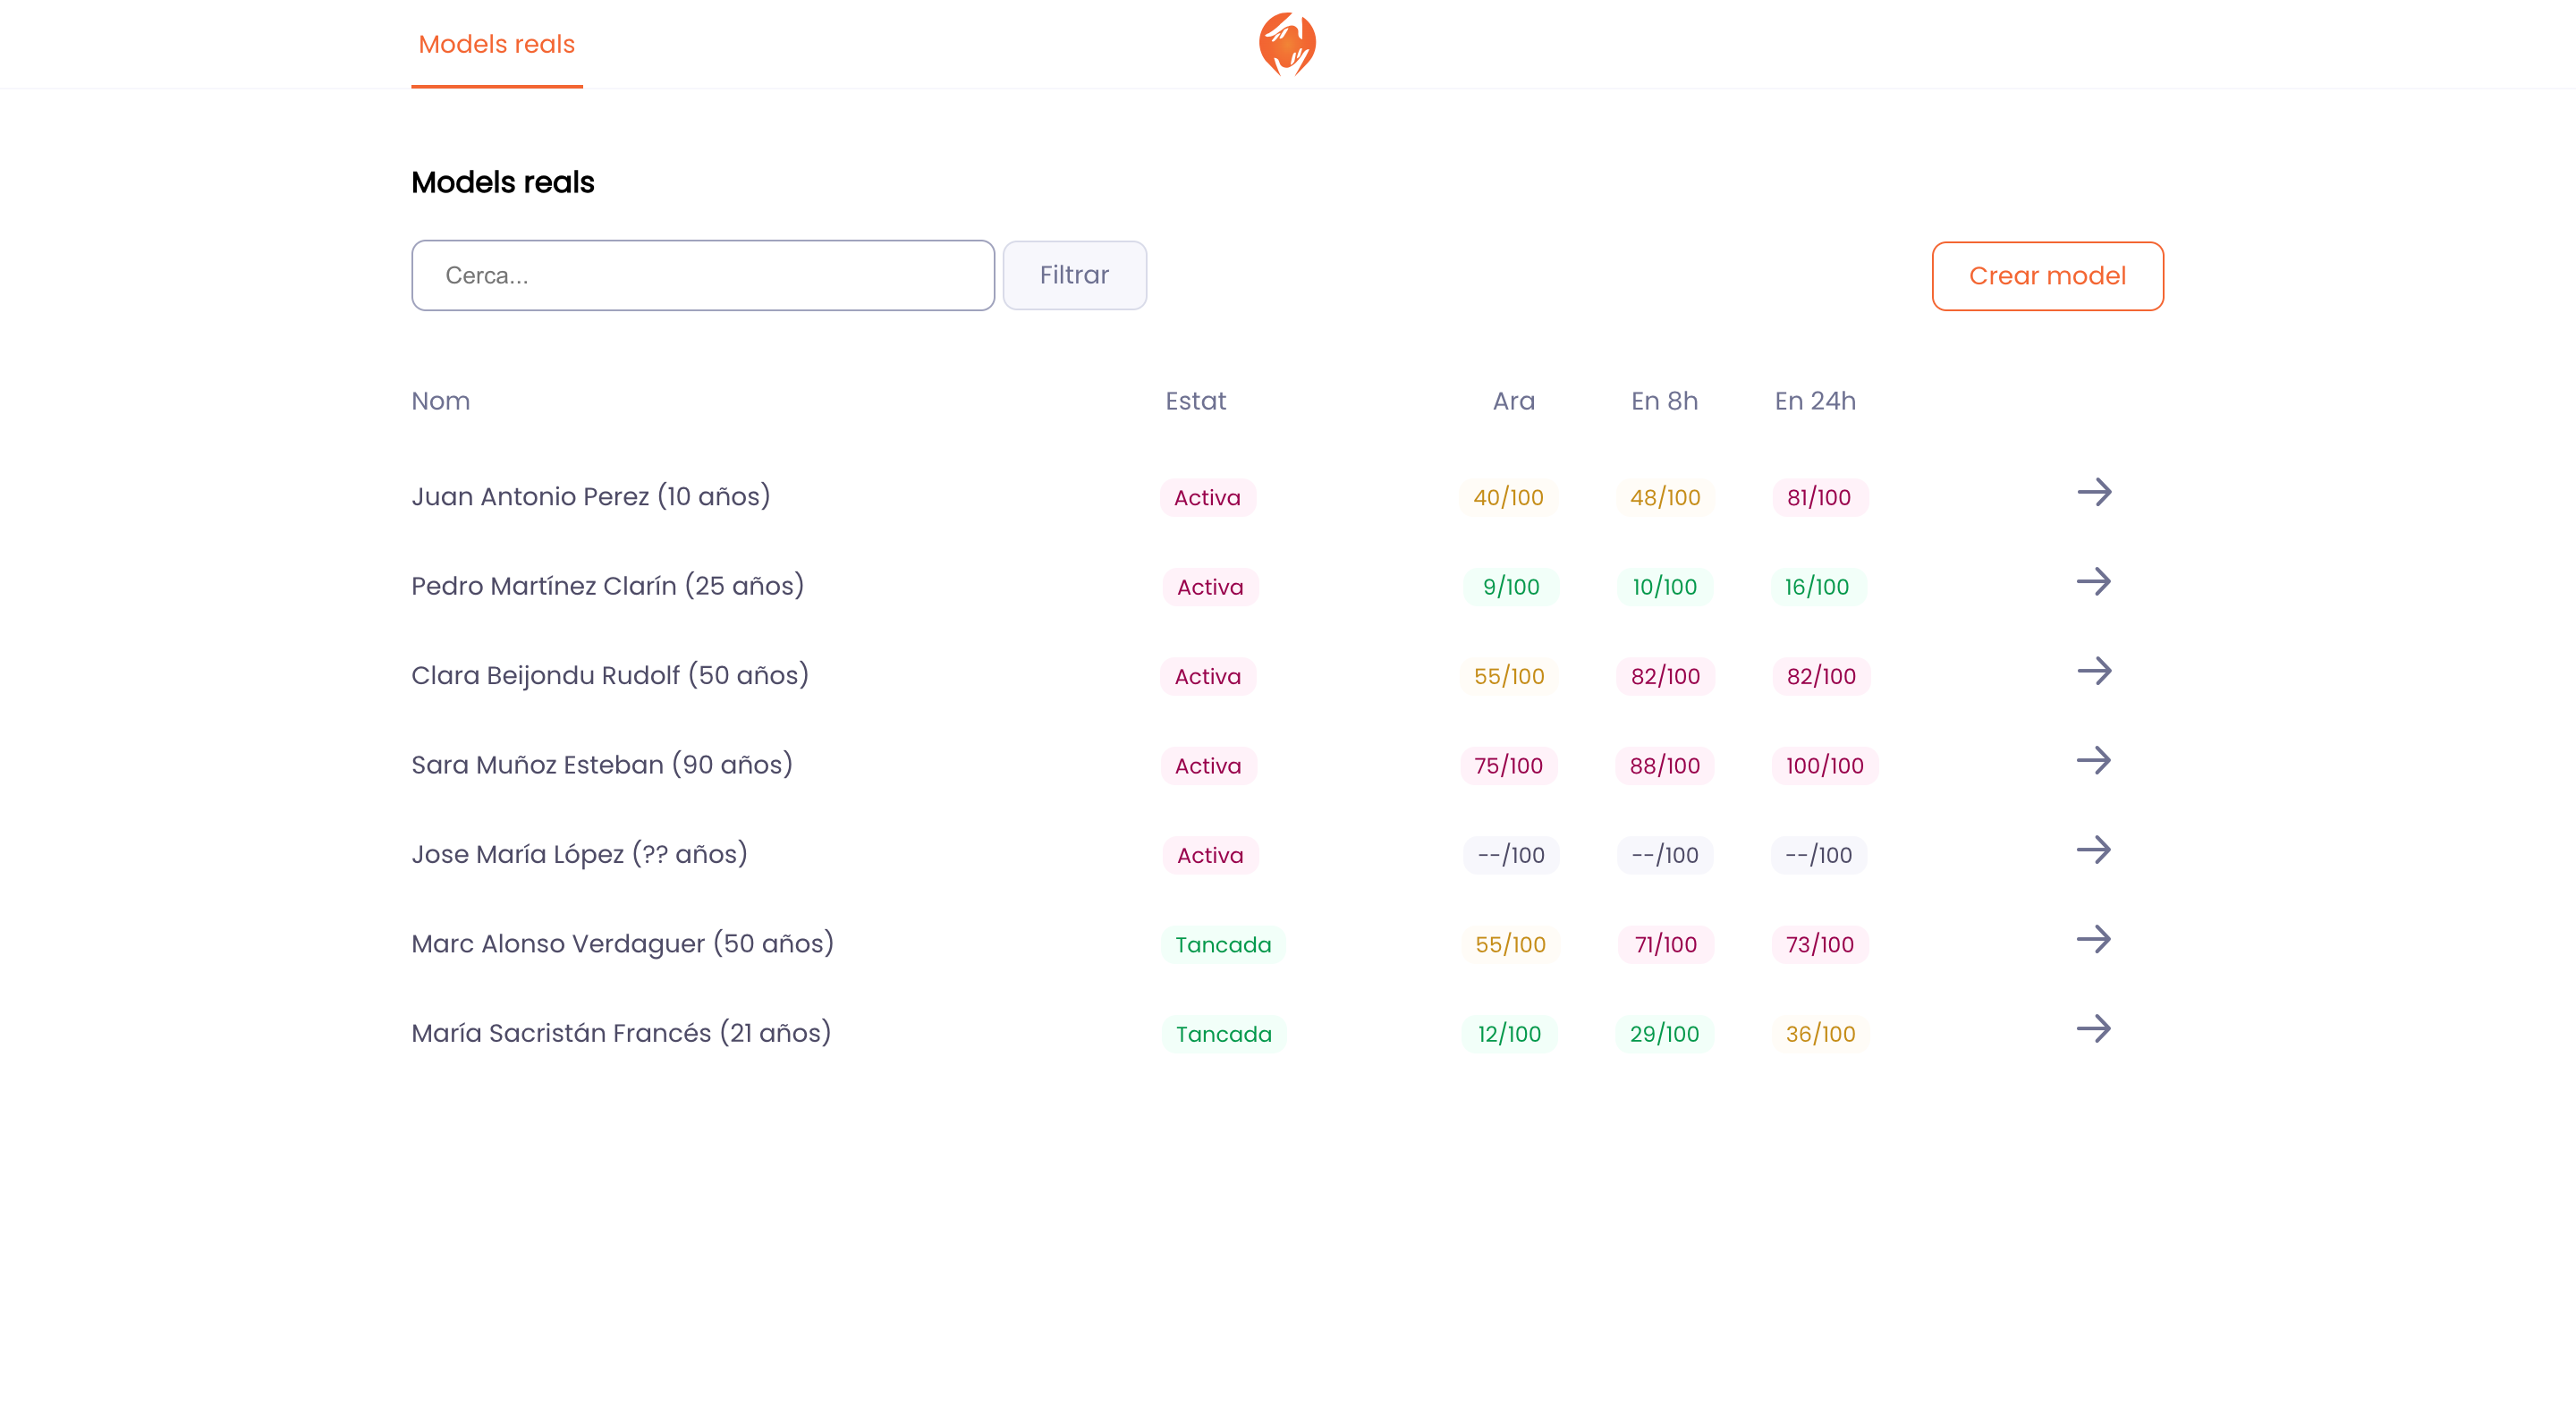
By v3 the model had grown from a calculator into case management: real operations as records, with status, search and triage-colored scores in one list a coordinator can scan.
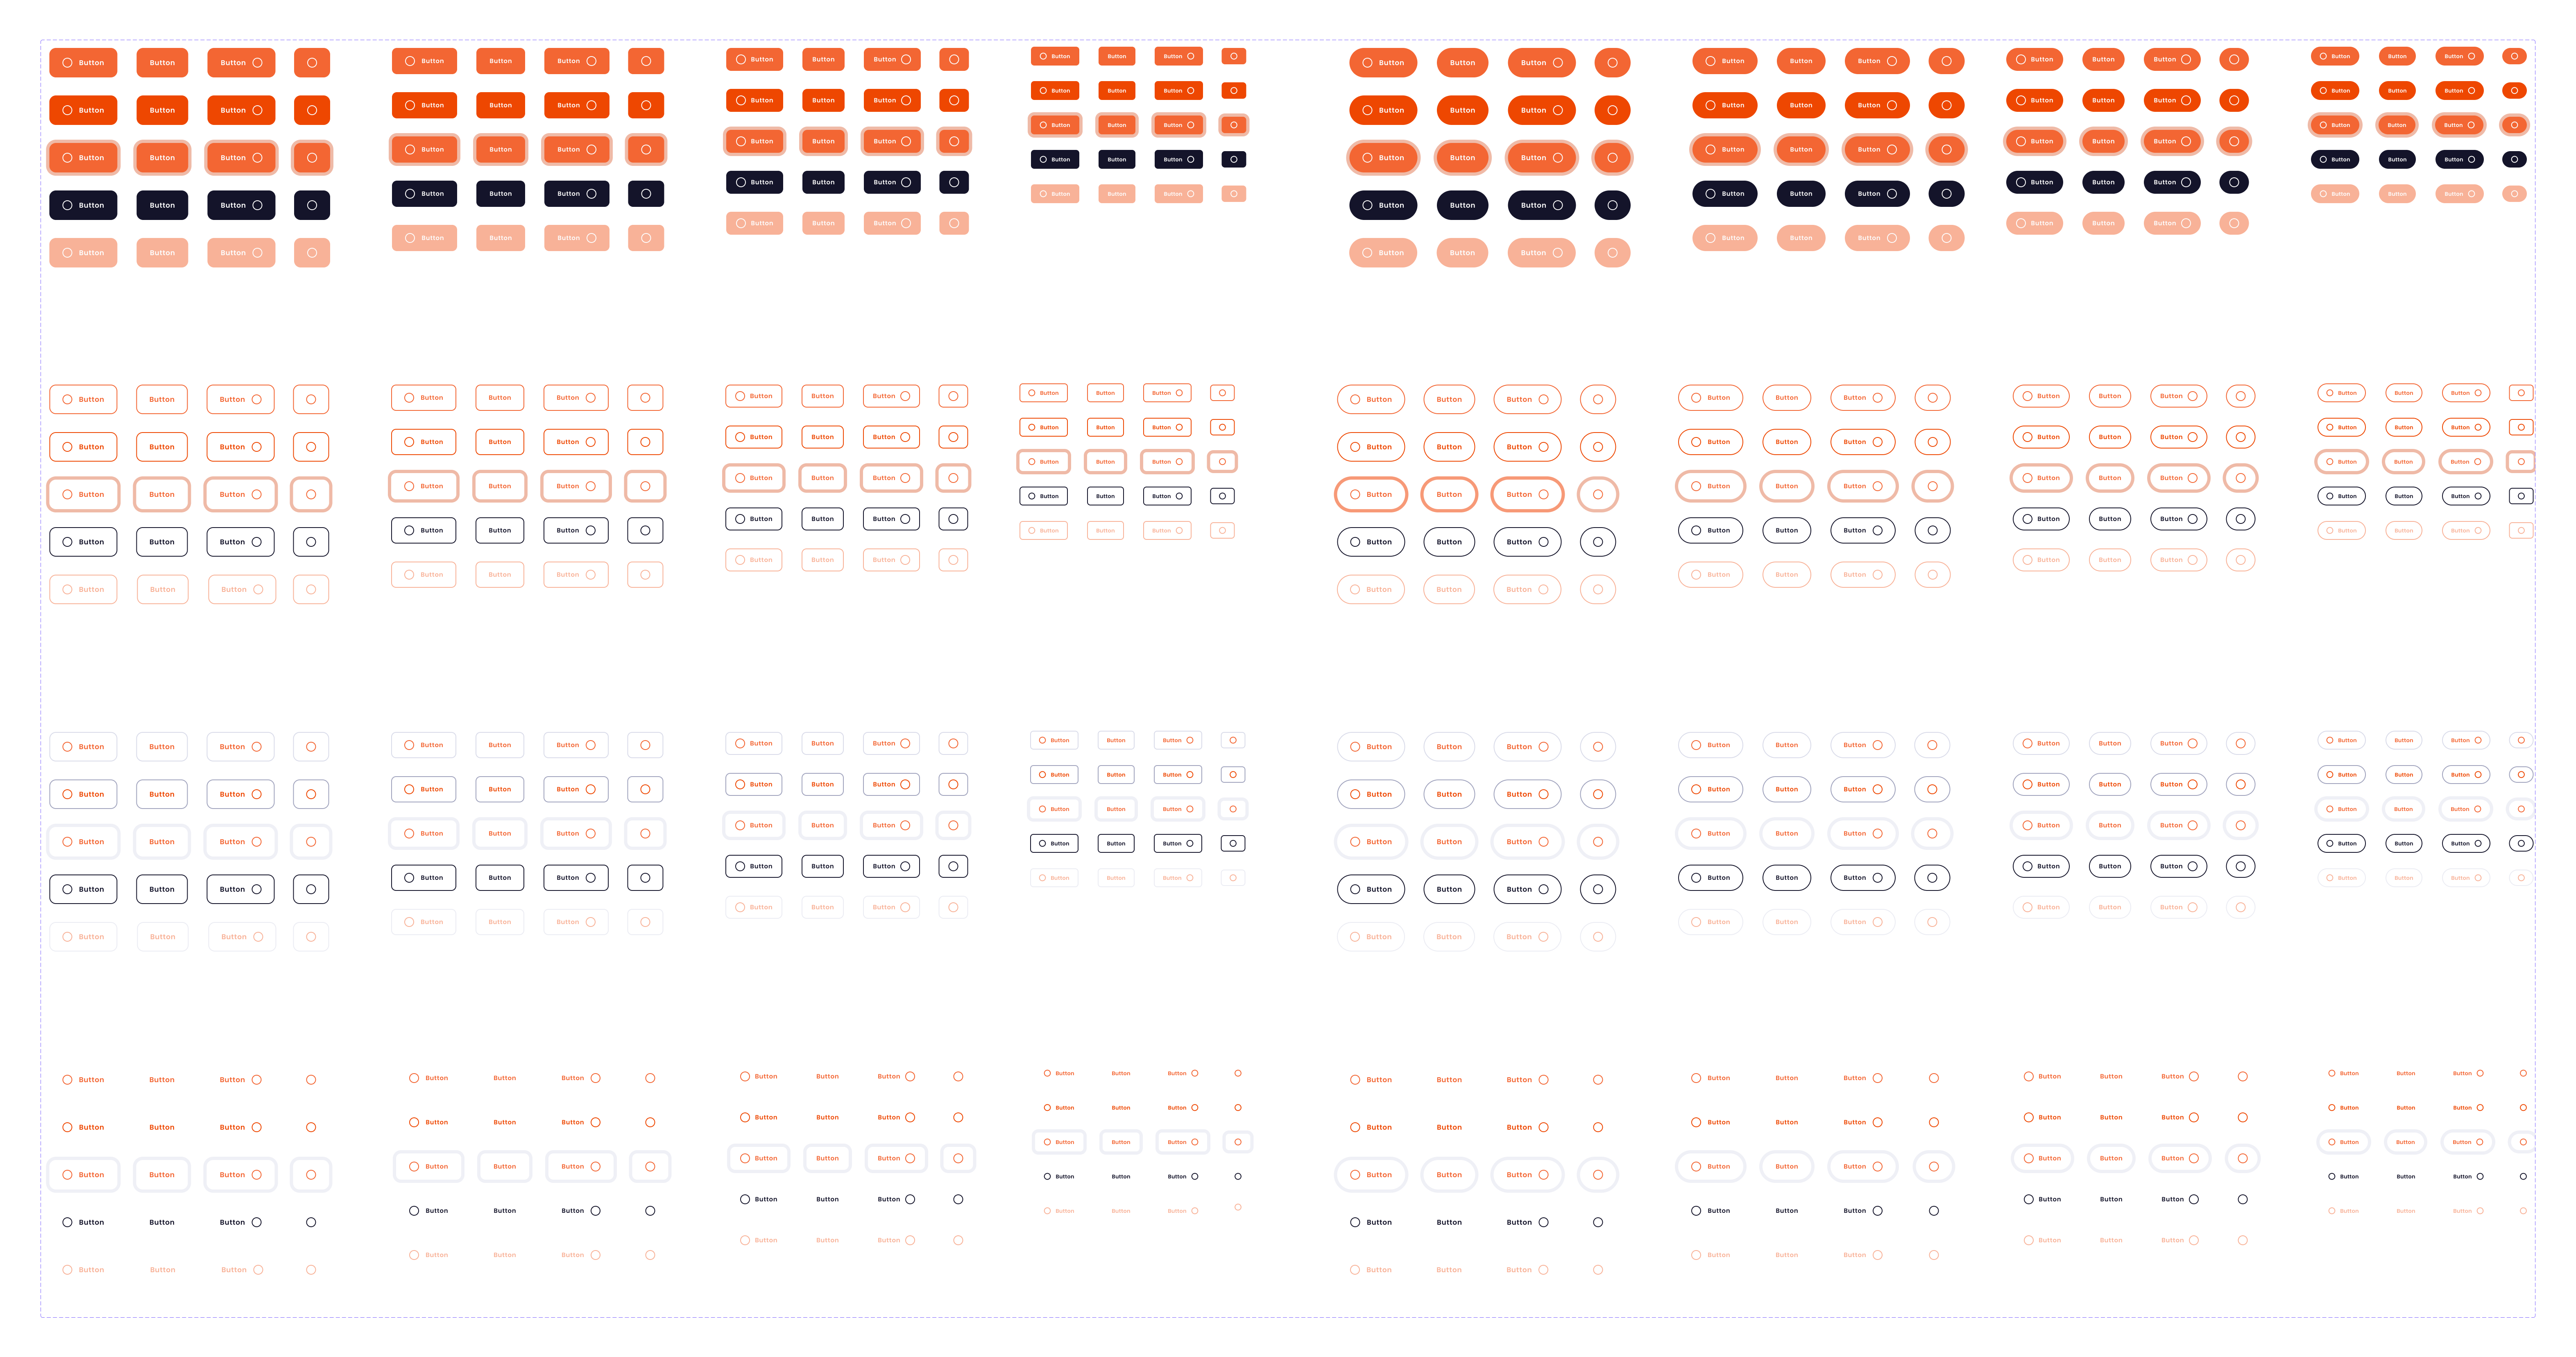
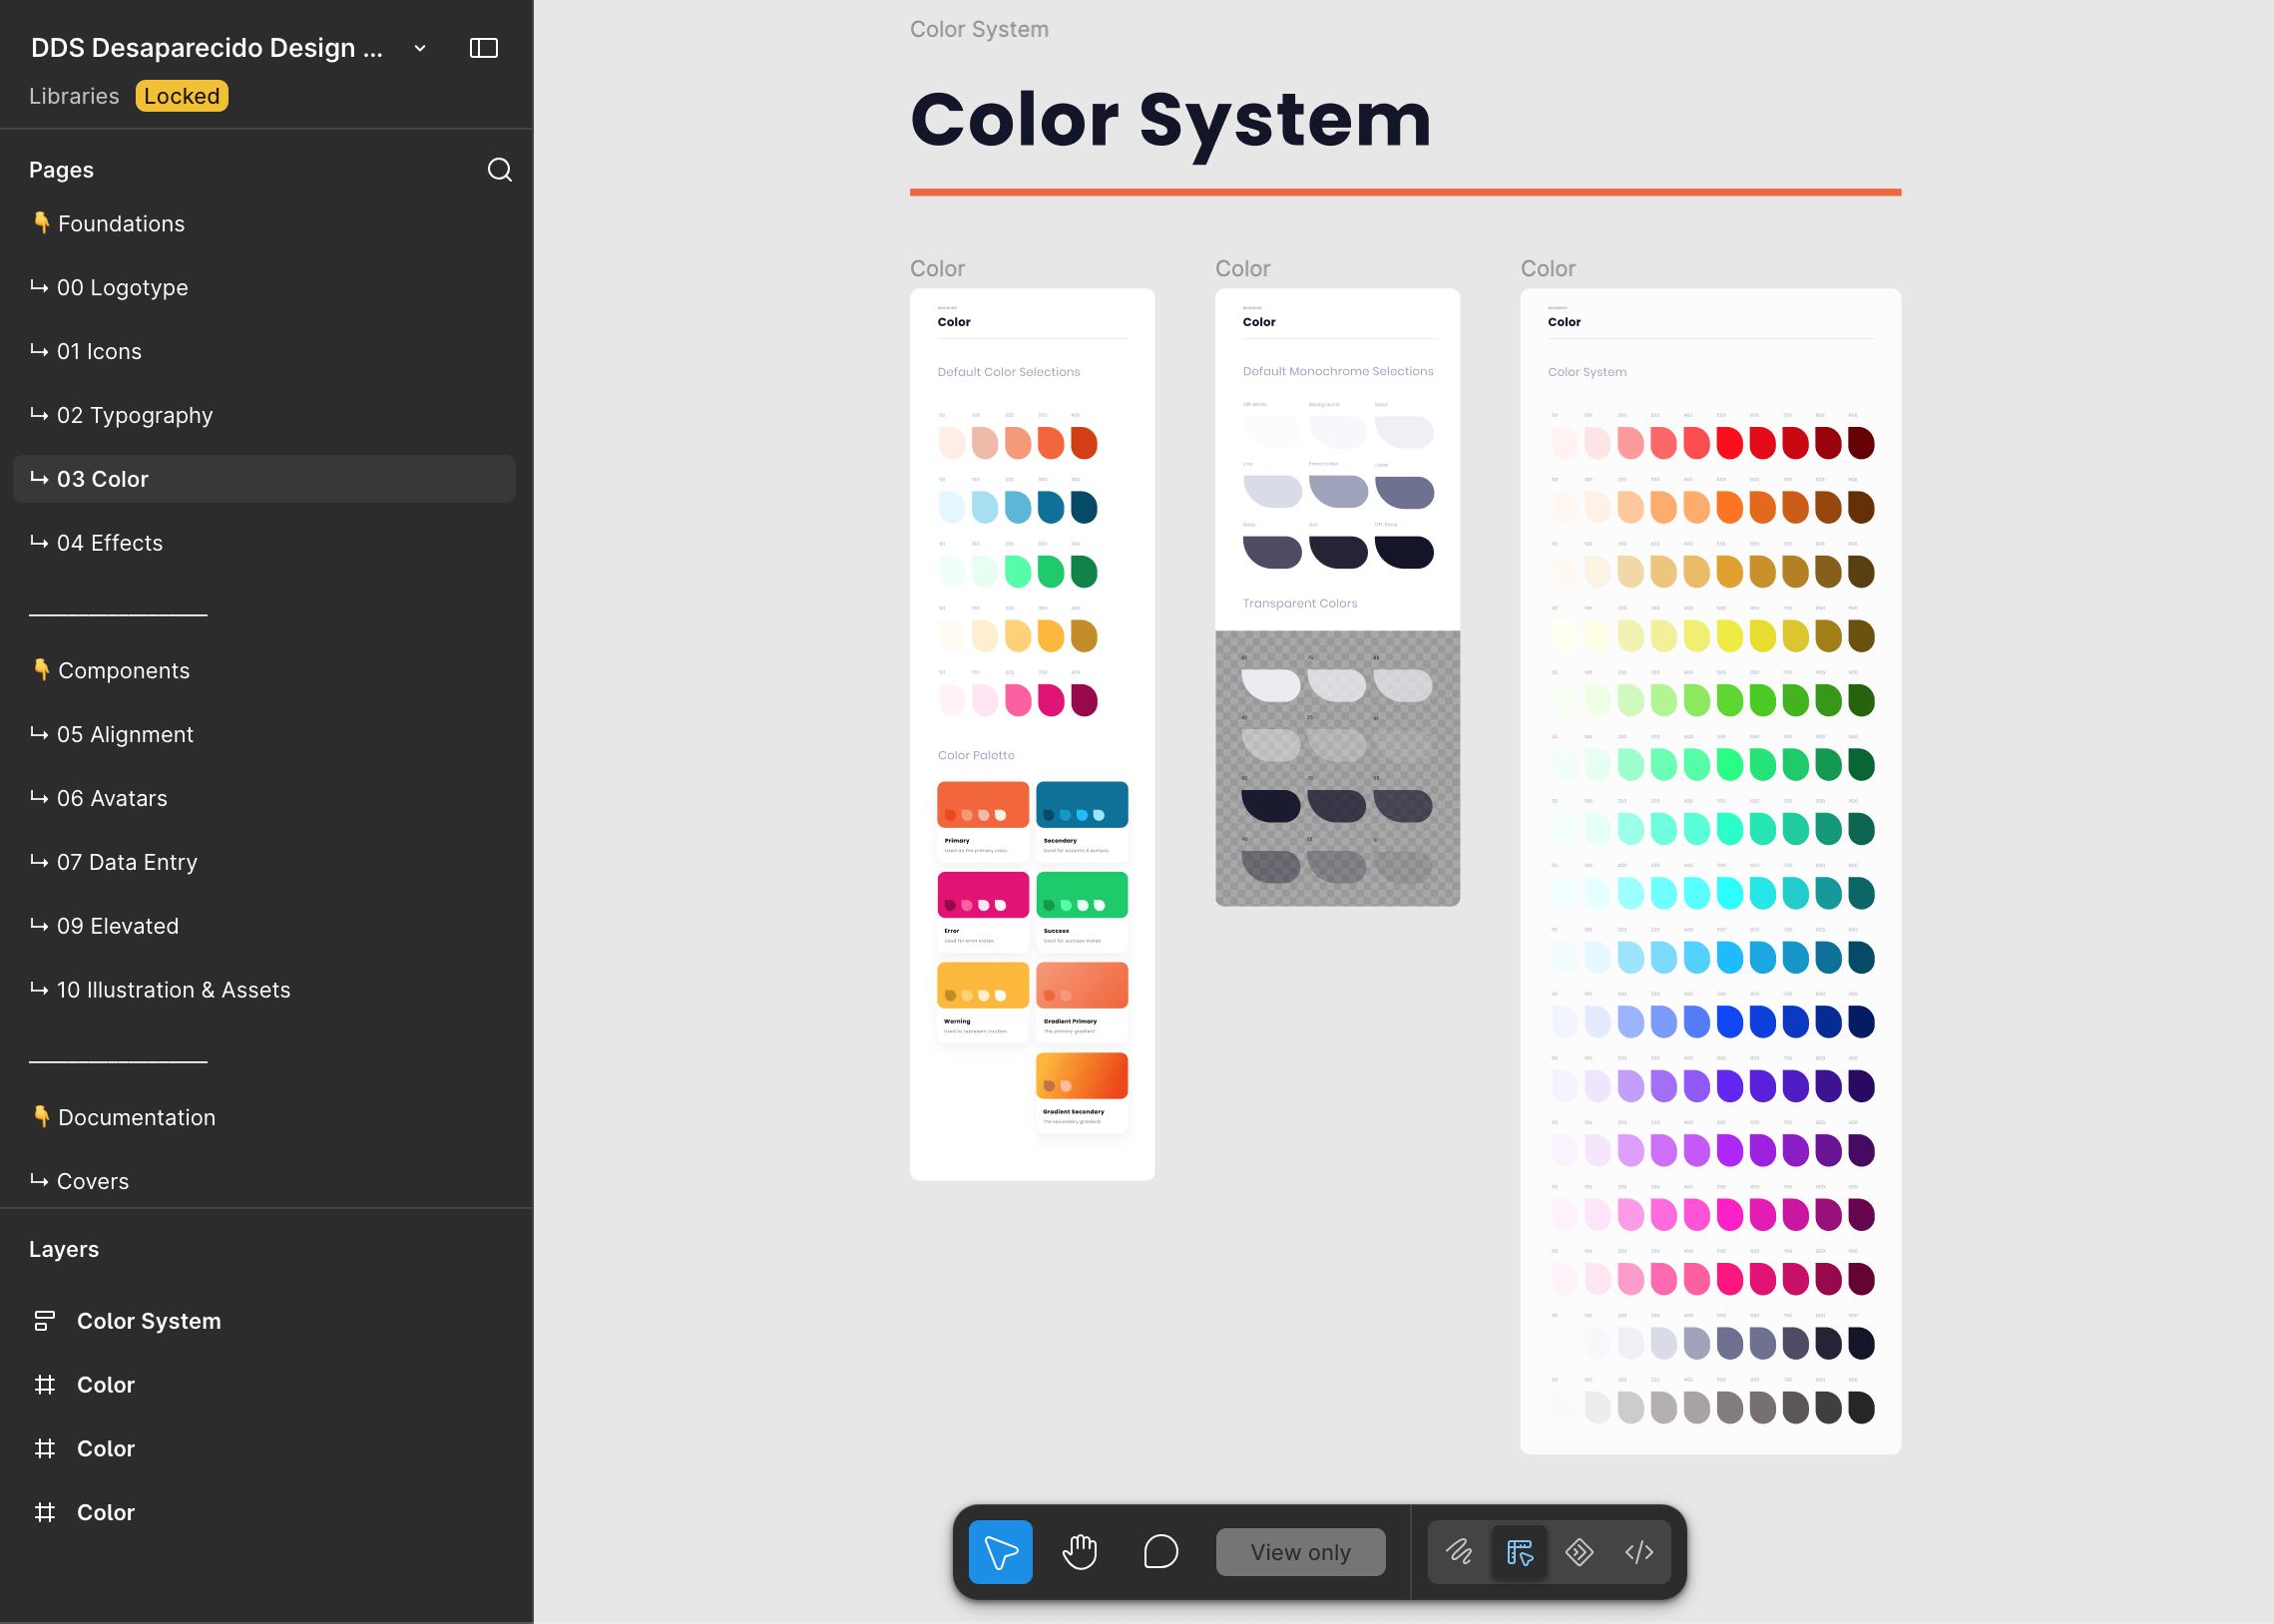
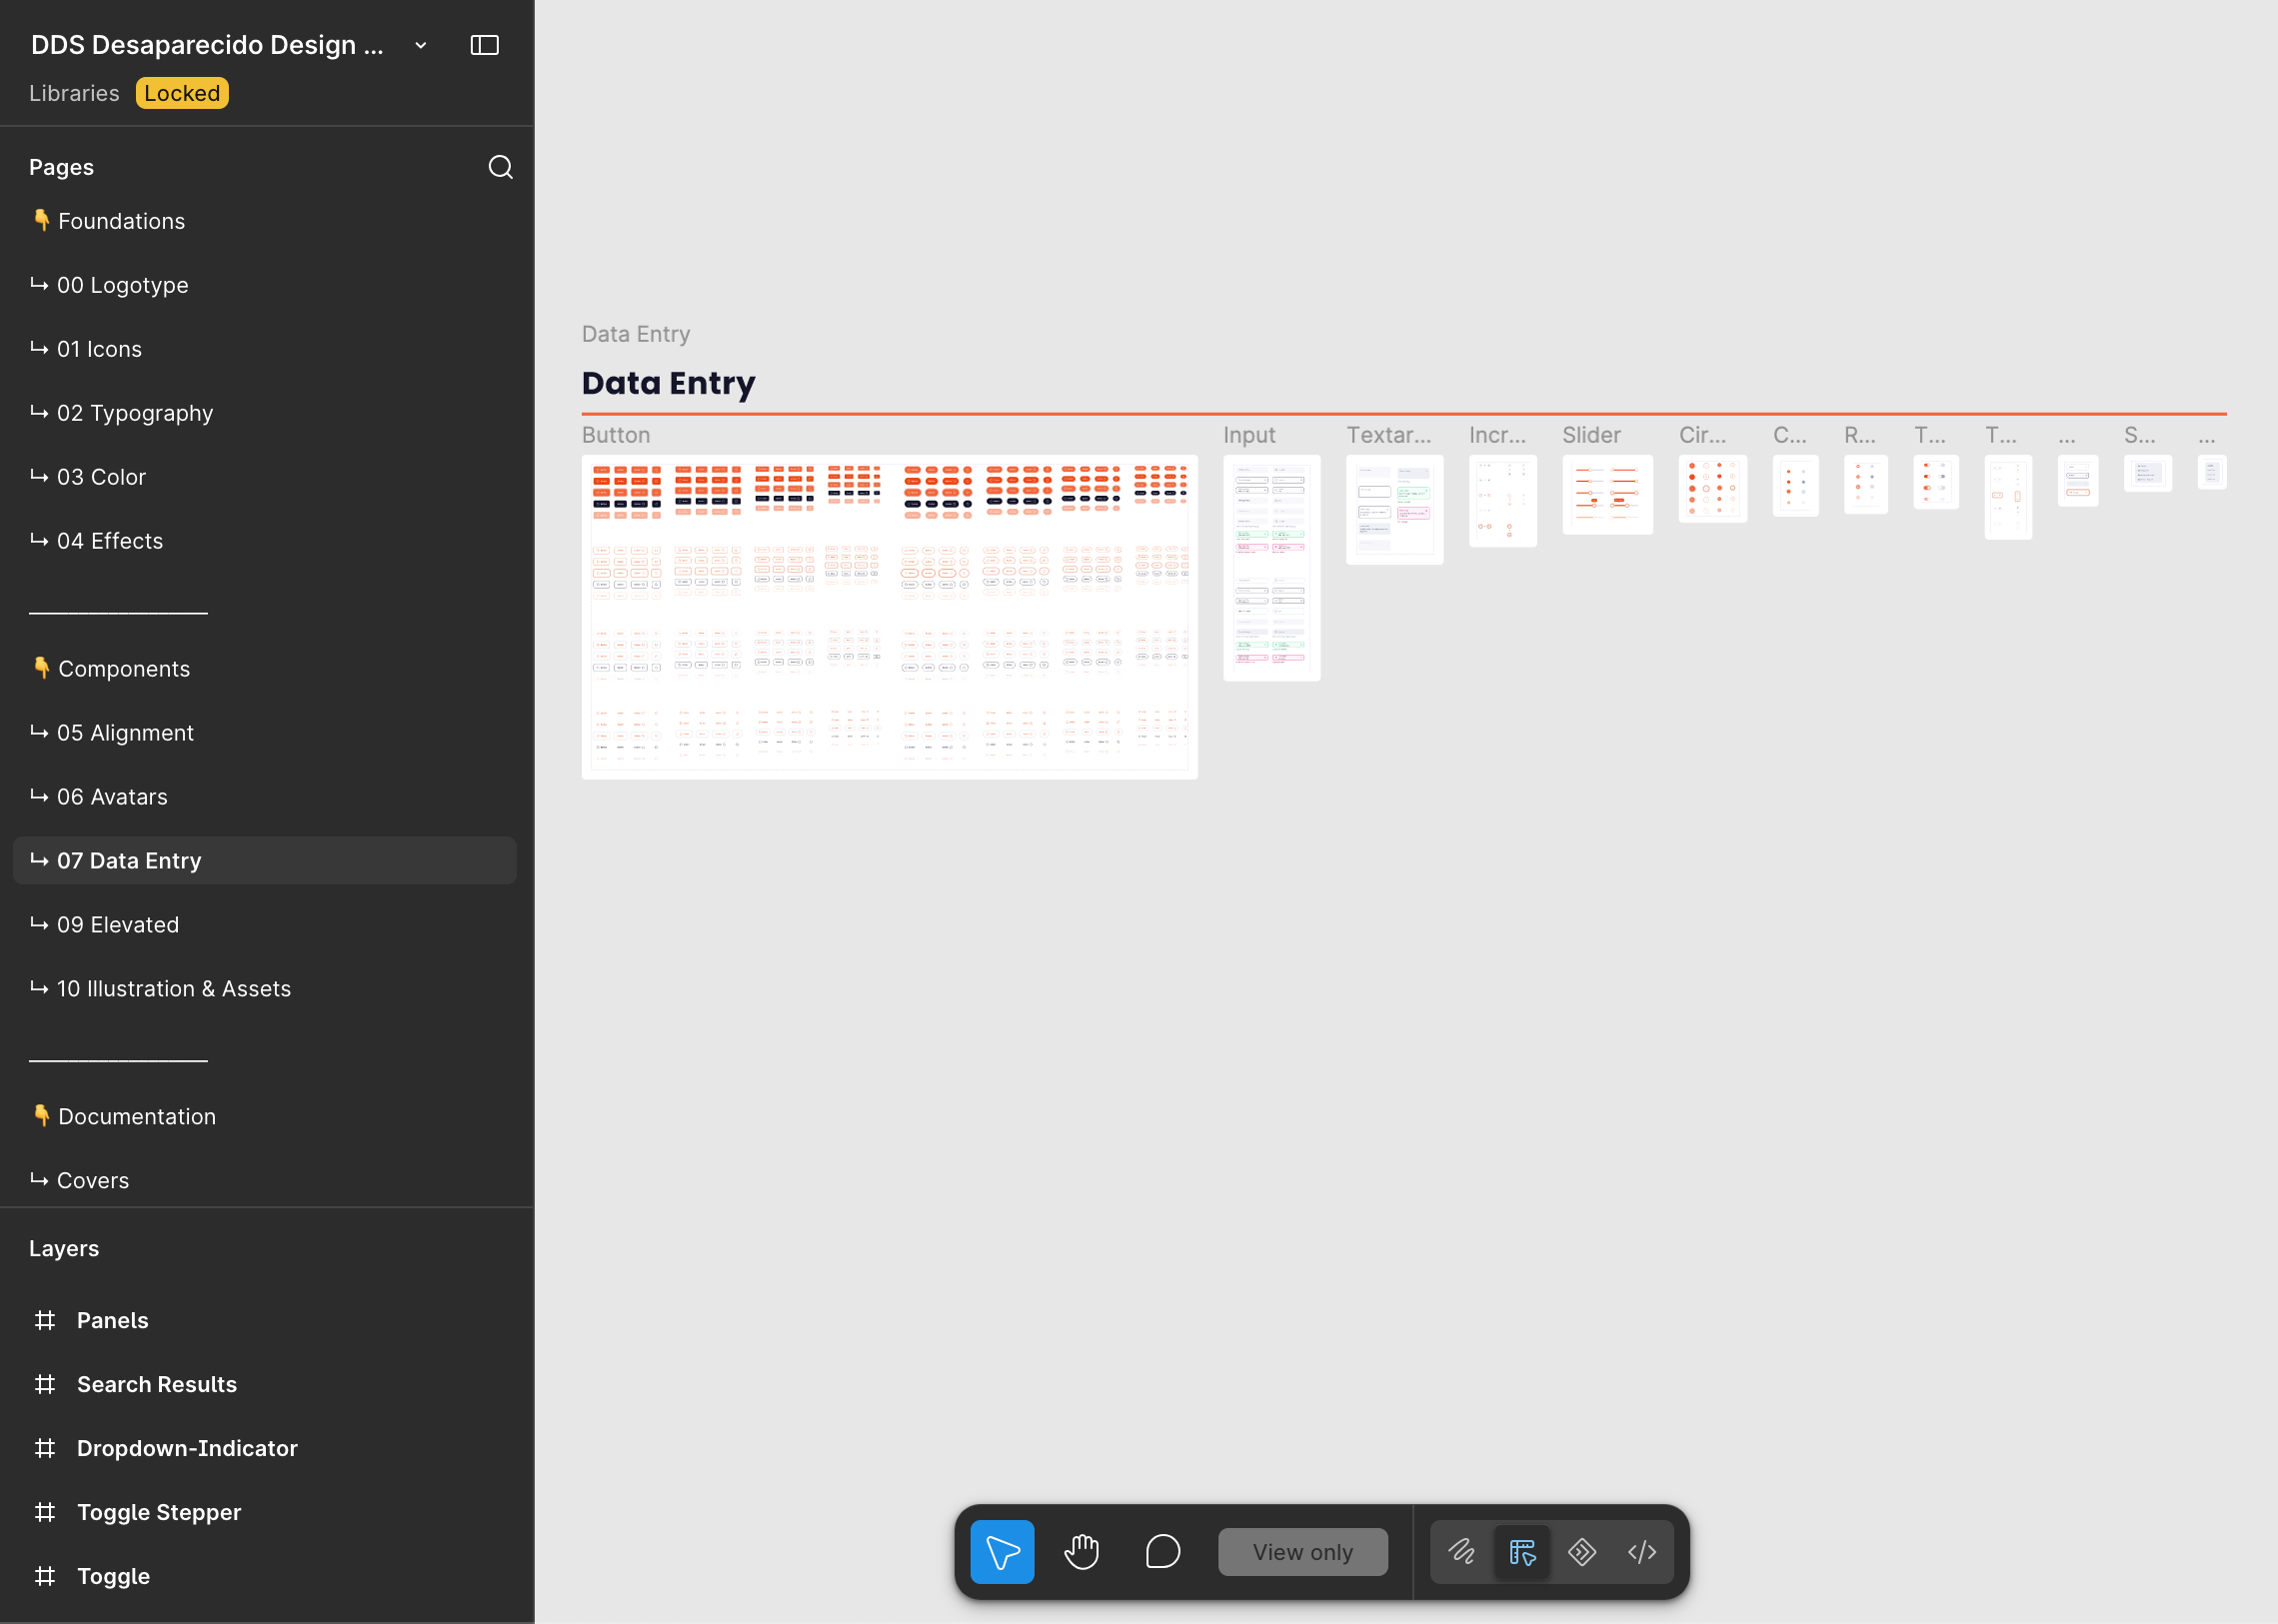
The product spread across Vue and Svelte, so a small design system kept it coherent: tokens as CSS variables, reusable form primitives, and a green/amber/red triage scale that meant the same thing everywhere. The per-factor contribution badges above are the clearest example: one component with one rule, reused across every field.
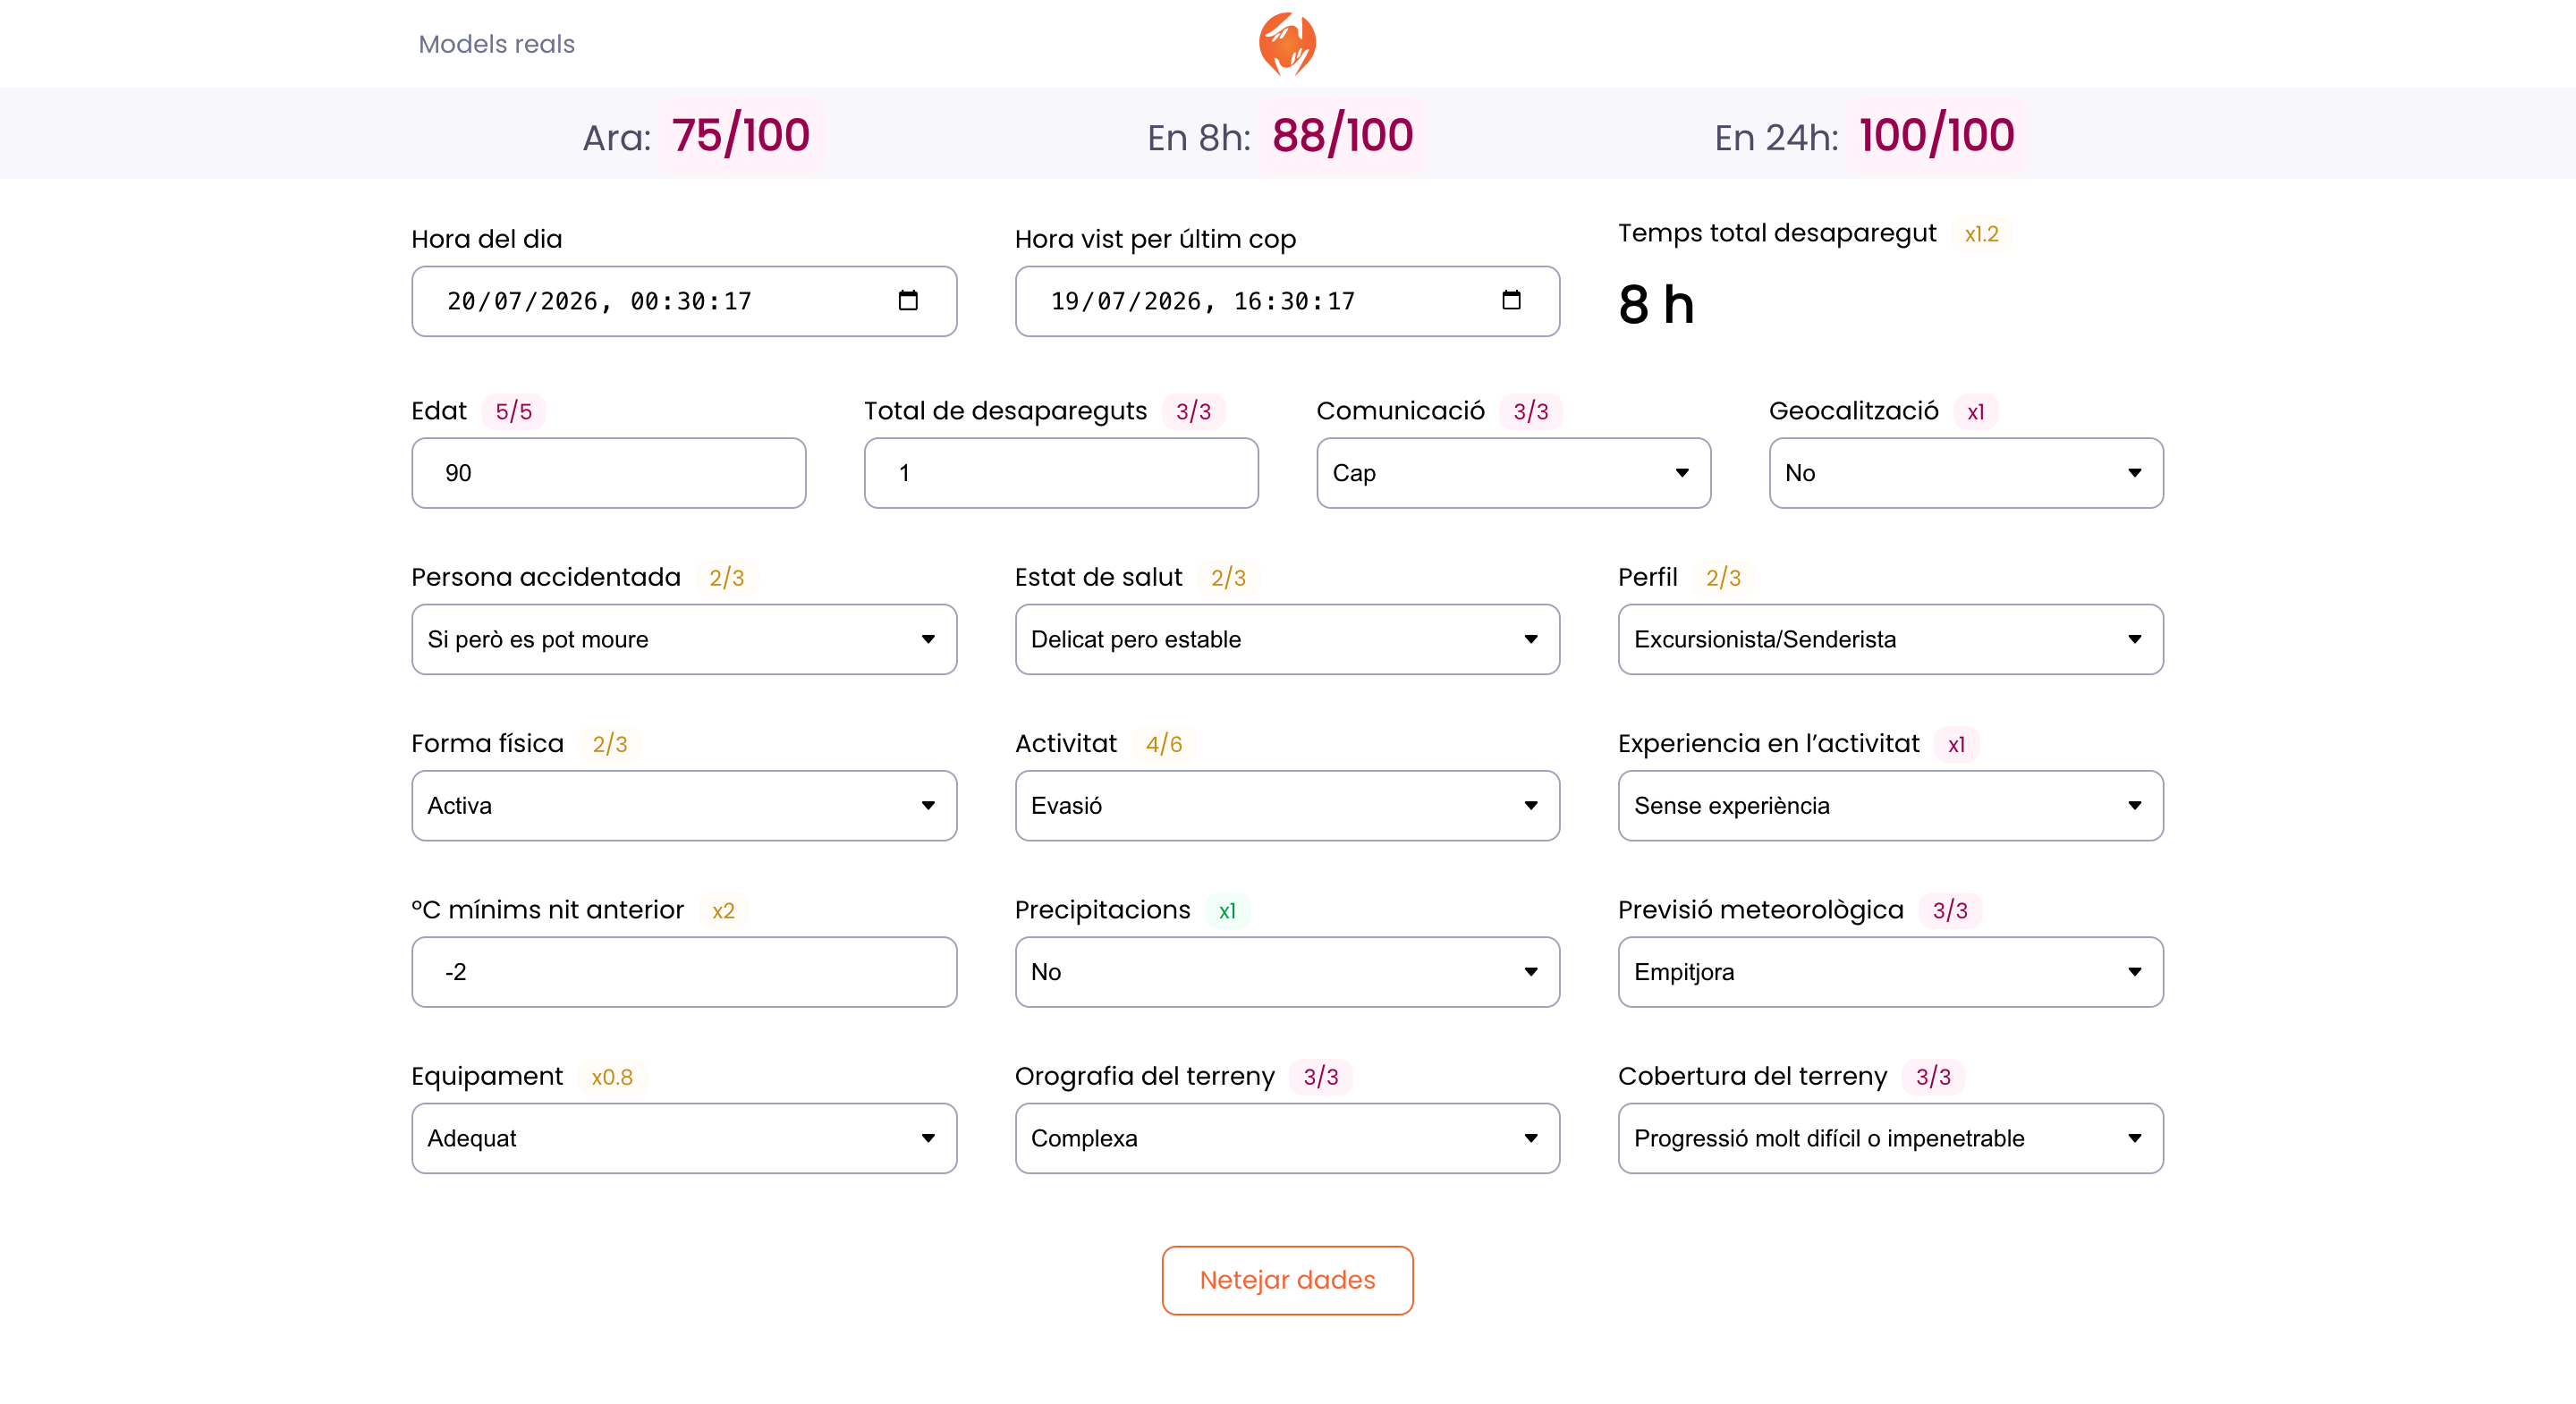
The clearest proof of the system is the before and after. v1 was a plain form with a single score; once the system landed, the same tool carried triage color, per-factor weight badges and three time horizons without losing legibility.
Trade-offs
Working with Spain’s emergency services
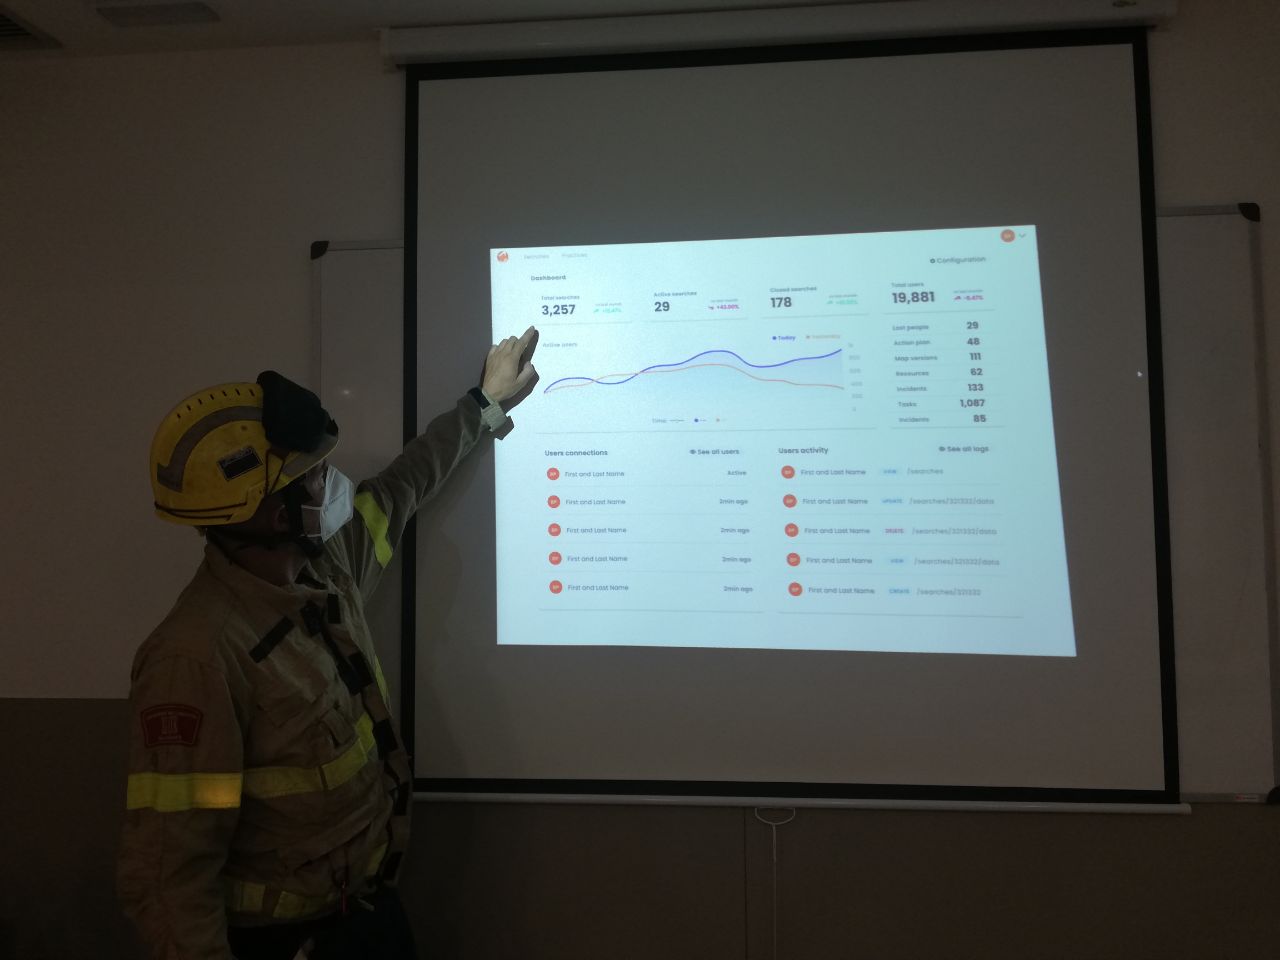
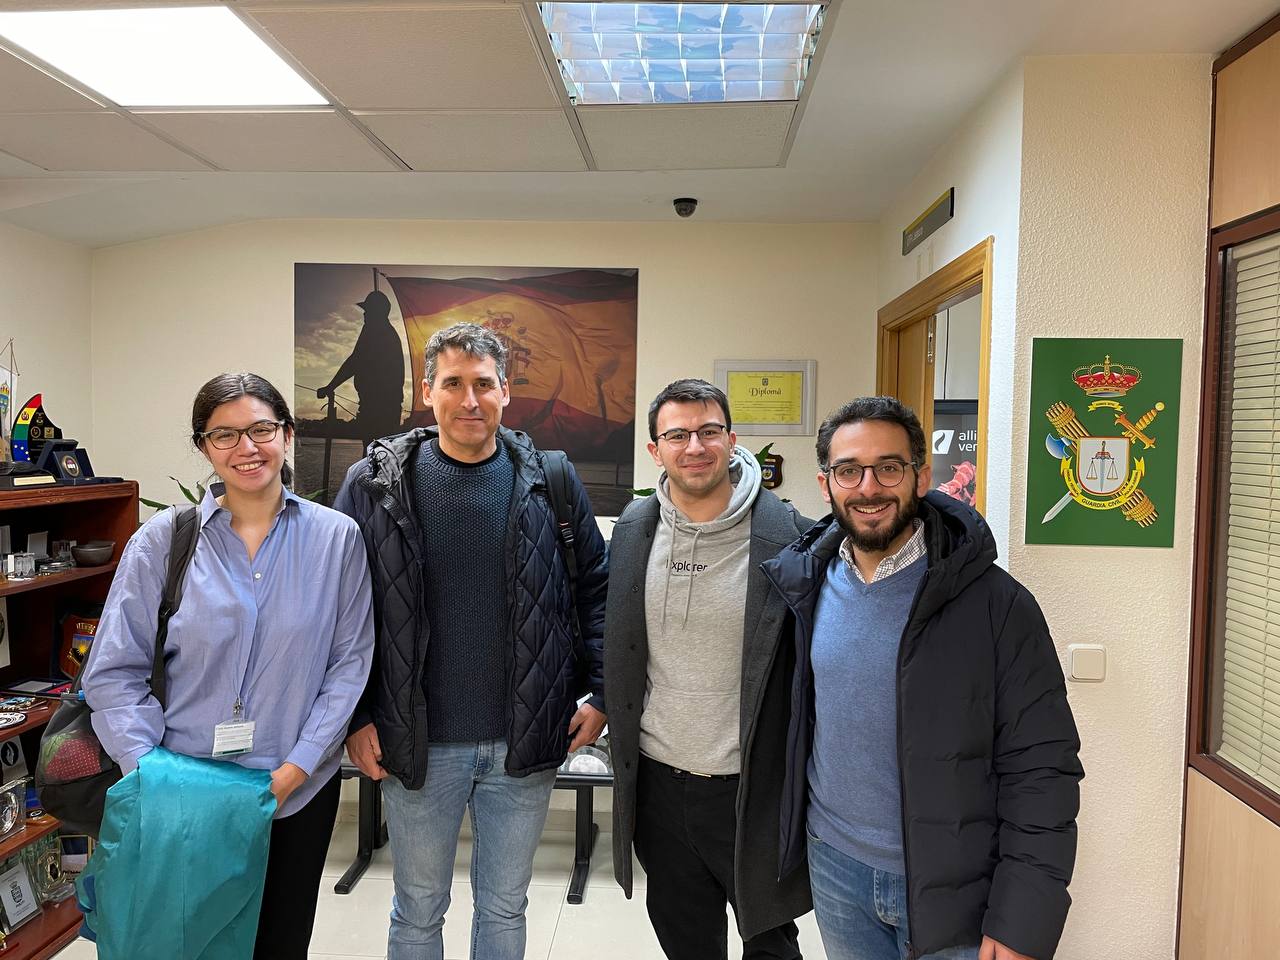
The thesis was built with the Girona fire brigade alone; the company reached further. From 2021 to 2023 we worked with the Bombers de la Generalitat, the Mossos d’Esquadra, the Guardia Civil, and the Ministerio del Interior. We designed a life-critical tool with the people who would carry it into the field, not for them.
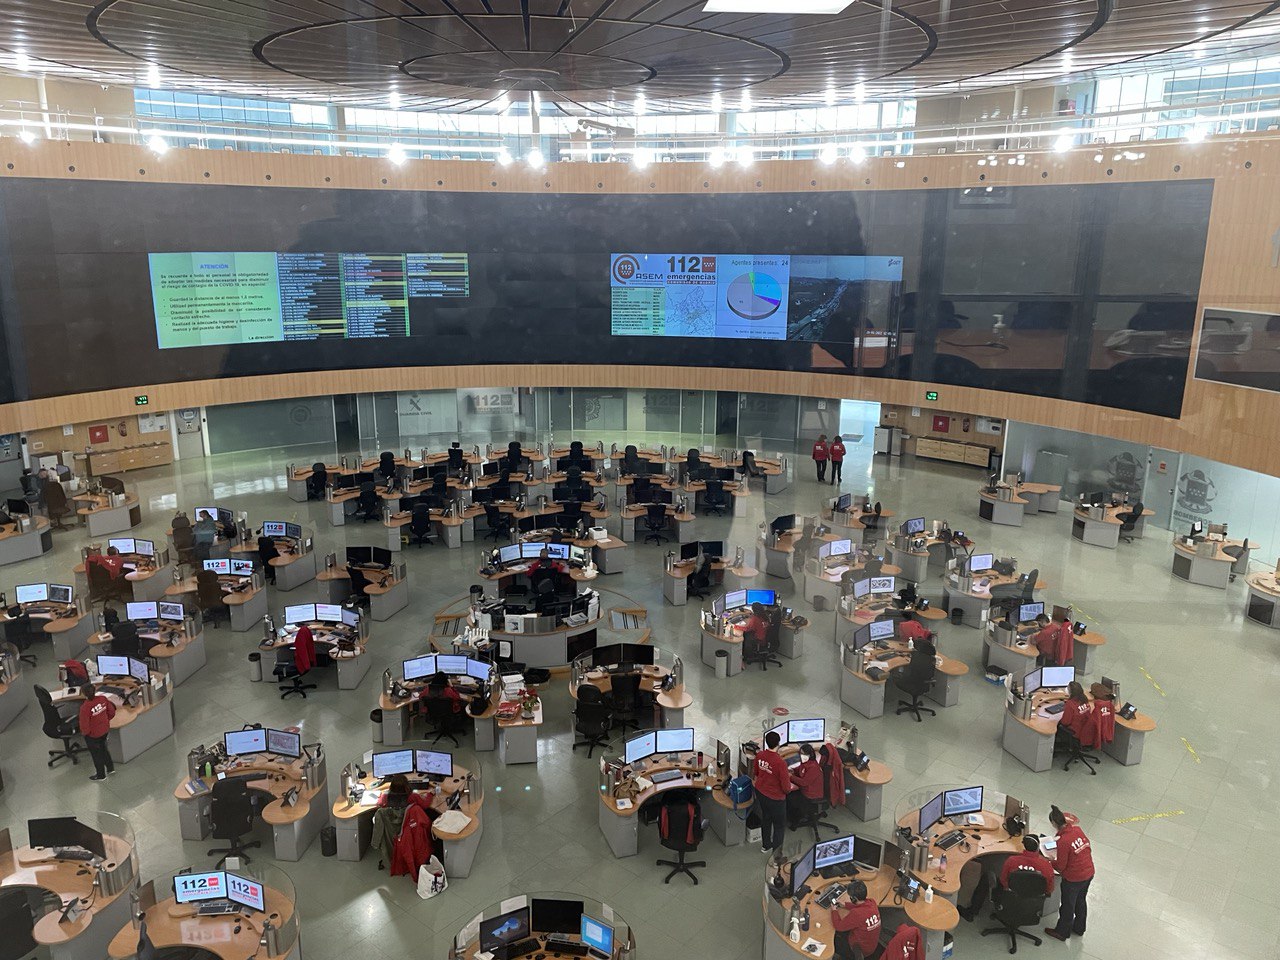
The field kept correcting the lab. Our first field test humbled the polished prototypes, so we changed how we researched: paper walkthroughs with actual coordinators first, high fidelity only once a flow survived on paper. It was the cheapest research method we used, and it taught us the most per week.
Validation & recognition
- A published Master’s thesis. Applications of machine learning in decision analysis for rescuing lost people (UPM), the research the company was founded on.
- Beta-deployed with the Girona fire brigade. Real operations logged end to end, and the design corrections that mattered most came from the field, not the lab.
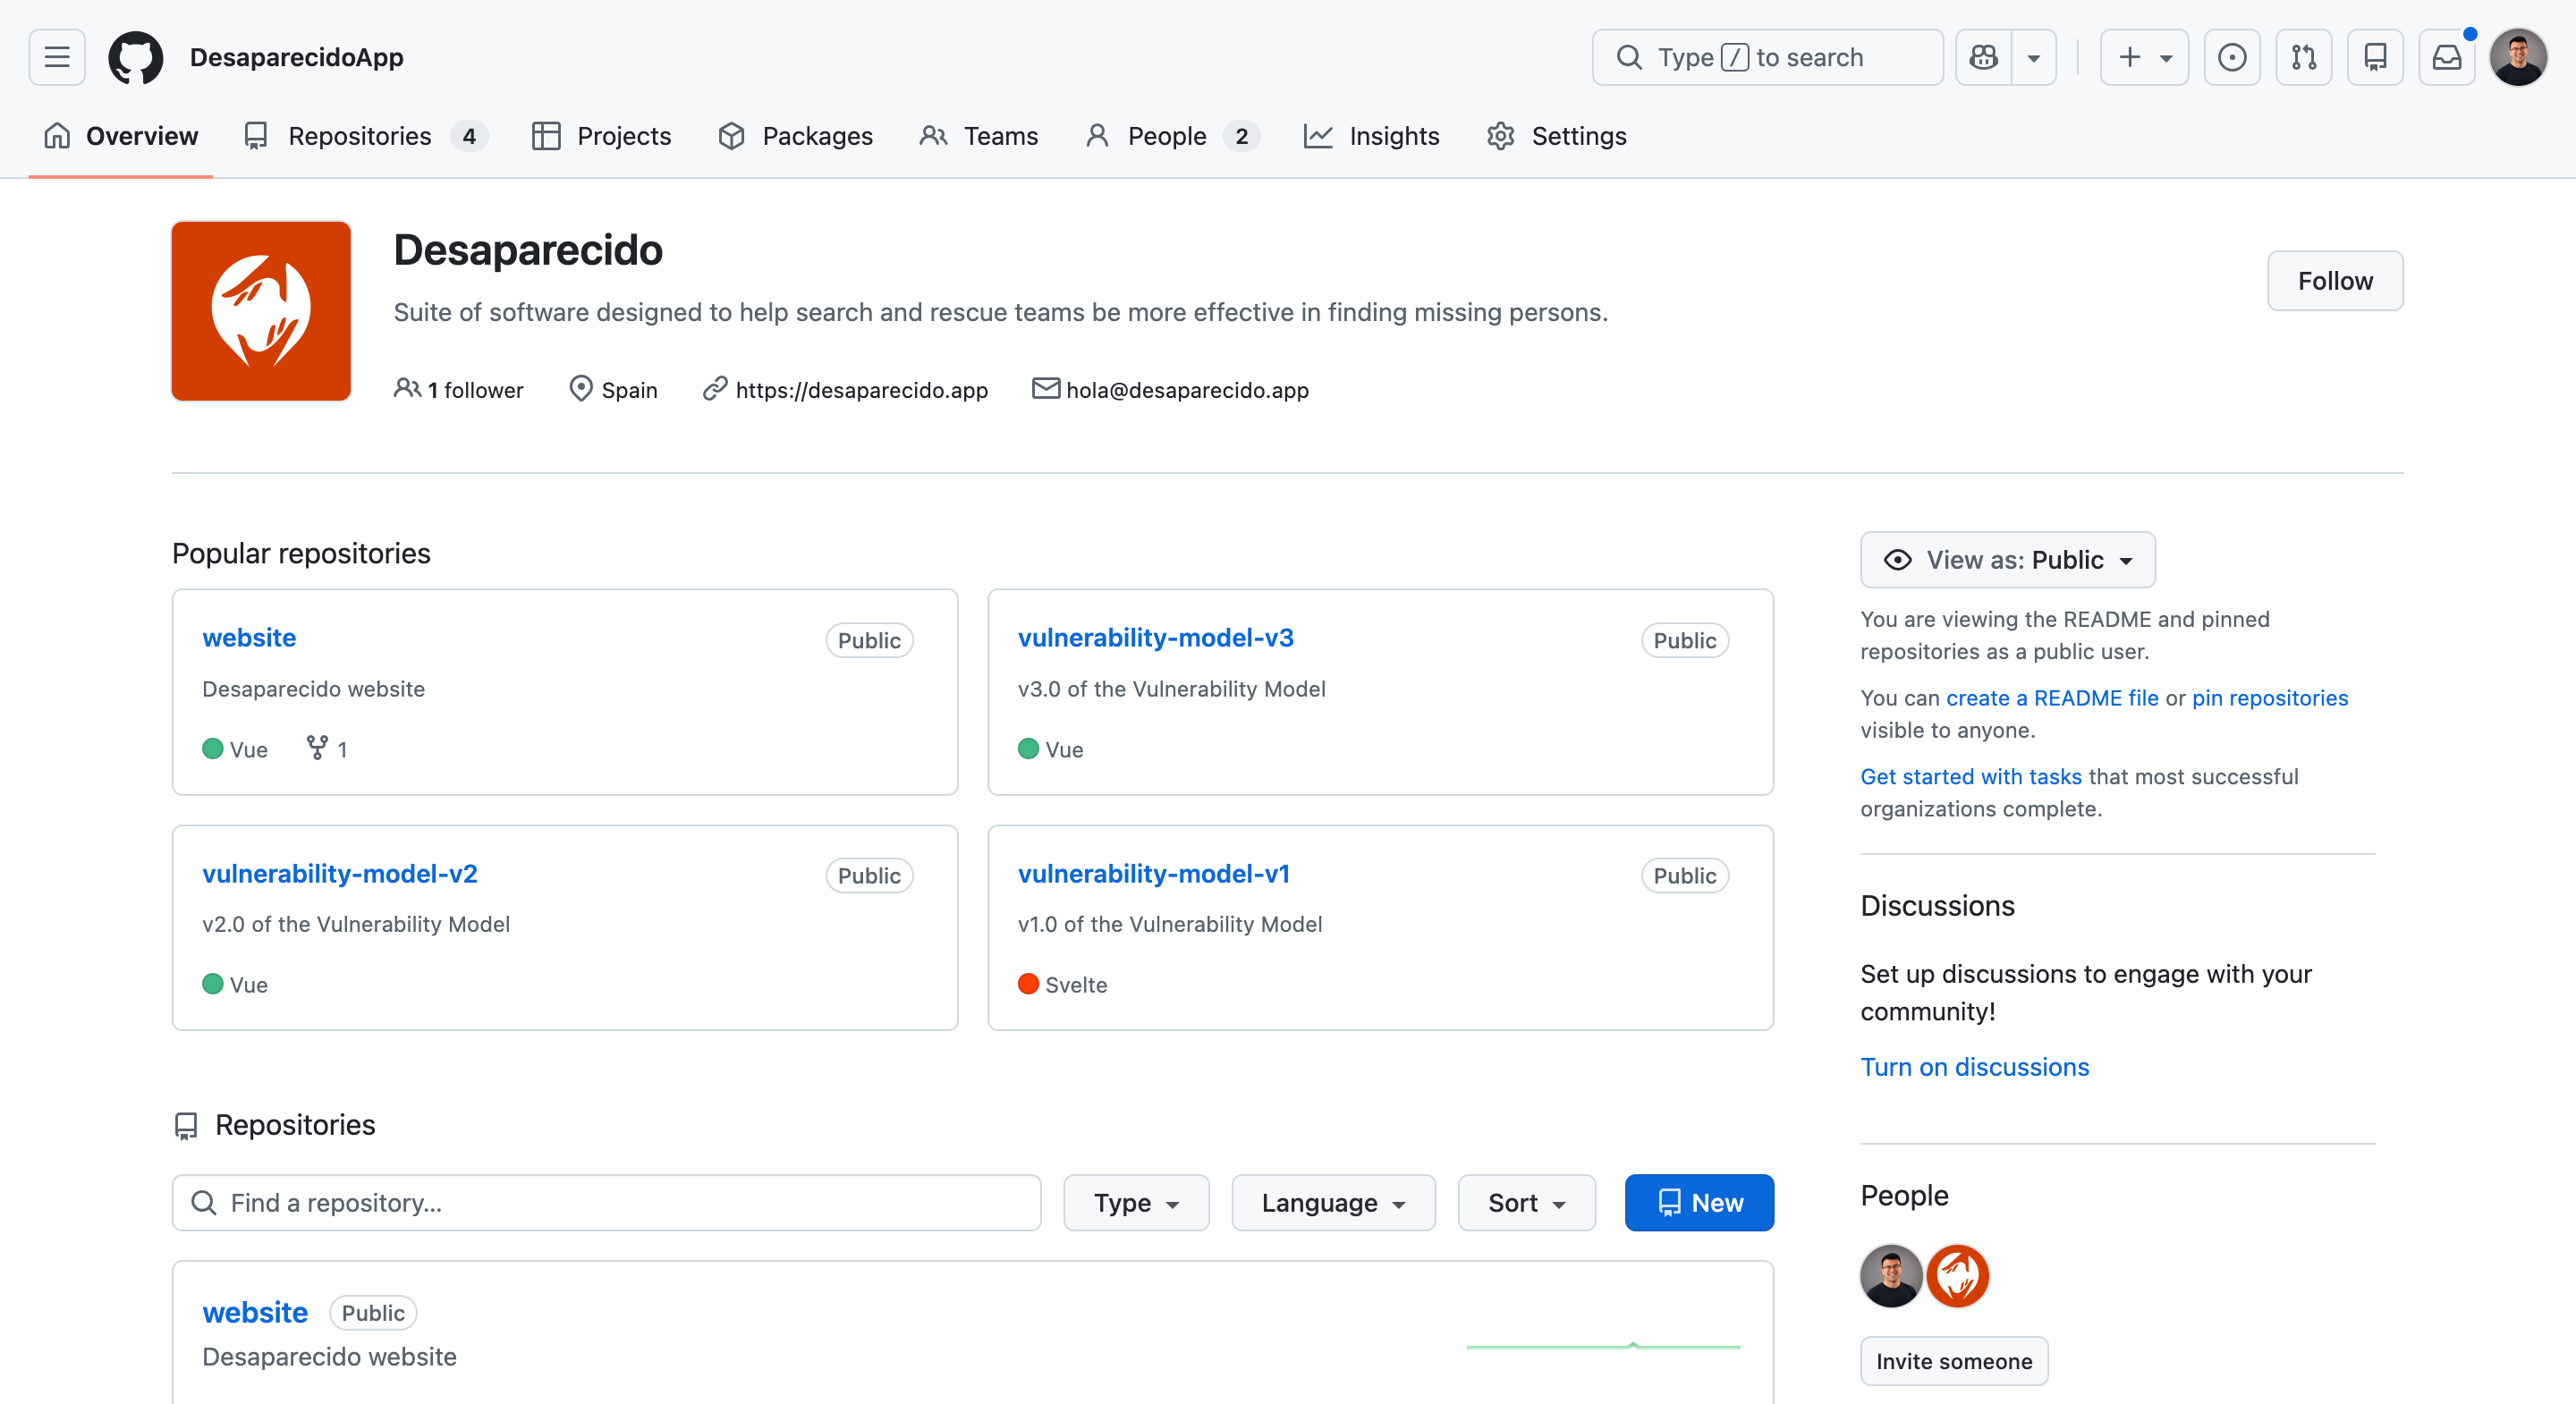
- Fully open source. Public on GitHub under GPL-3.0. The vulnerability model shipped three iterations, each still live: v1 in Svelte (repo · live), v2 (repo · live) and v3 (repo · live) in Vue.
- Shared in public. Presented in talks and to Spain’s emergency services, in front of the people best placed to challenge it.
Results & reflection
What shipped: a front-to-back platform (GIS coordination interface, the live Vulnerability Model scoring engine, offline operation, and the ML pipeline behind it), built by a 3-person startup and put in front of real rescue teams.
What I’d do differently: start with the paper walkthroughs from week one, instead of arriving at them through a humbling field test. For a domain this unfamiliar, high fidelity too early is just expensive guessing. I’d also budget for structured post-operation debriefs from the start.
The bigger lesson was commercial. I owned product and design and let the go-to-market path wait, which with public institutions means procurement, budgets and tenders measured in years. Mapping who buys, who signs and on what cycle should have started in month one, with the same rigor we put into the model.
Open source turned out to be a distribution strategy, not a funding one. It earned trust with the emergency services and kept the work alive after the company, but I’d pair it from the start with a real funding path: grants, public contracts, or a service layer on top.
The prediction lesson held here too: the score only earned trust because coordinators could see every factor and challenge it. A model that just announces the future gets ignored the first time it’s wrong.